A population health data and analytics platform to improve outcome, elevate quality, and help lower the cost of care.
Improve Outcomes
Leverage actionable insights to create more resilient, responsive, and community-centered care models.
Elevate Quality
Enhance care delivery with data-informed insights to optimize organizational performance.
Reduce Costs
Streamline operations with automation that lowers expenses while improving efficiency.
Intelligence to Drive Transformation
Gain access to rich data, advanced analytics, and actionable insights to navigate a rapidly evolving landscape.
Automated Reporting
Eliminate manual processes and meet regulatory mandates like IRS CHNA, CMS HEIP, and NCQA effortlessly.
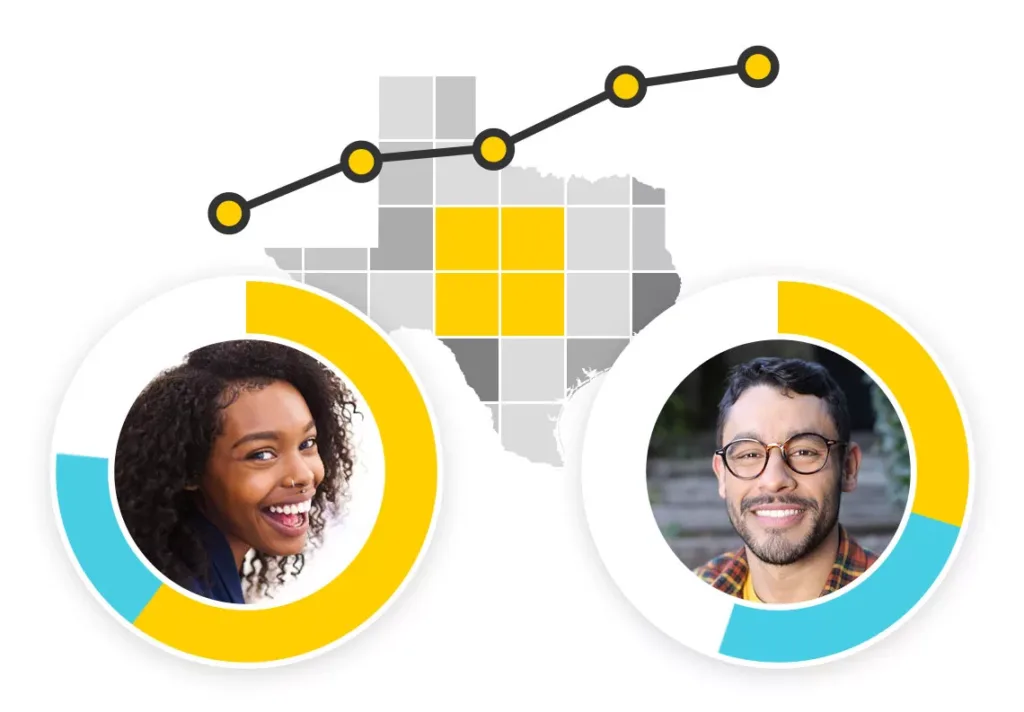
Performance Benchmarking
Compare your performance against industry peers and pinpoint opportunities for growth.
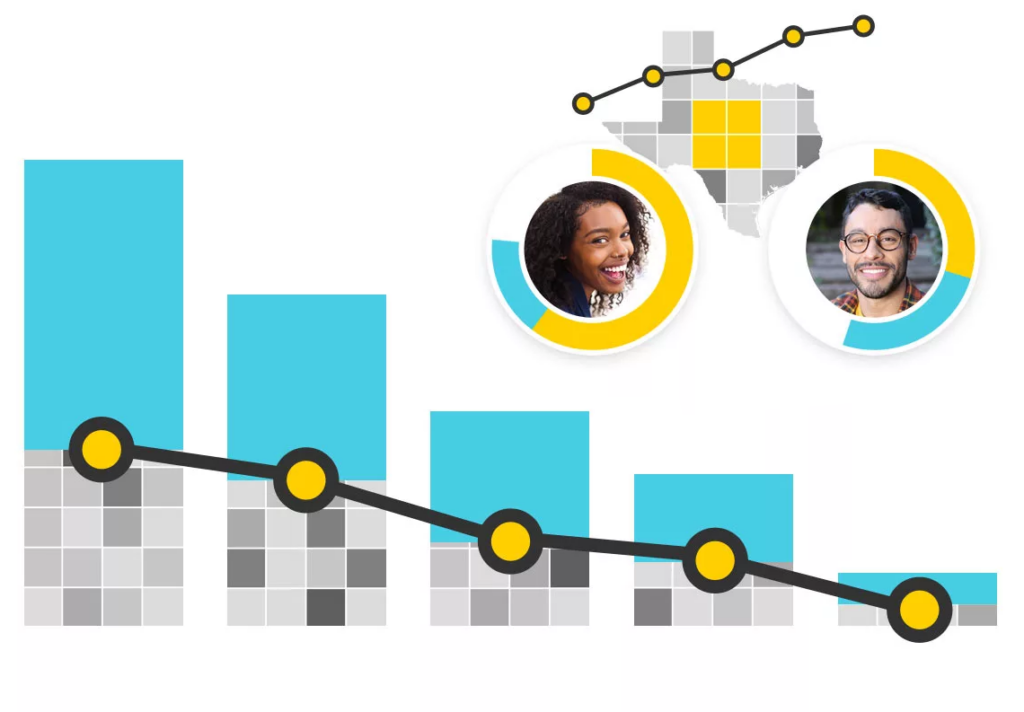
Predictive Forecasting
Stay ahead of healthcare trends and optimize resource allocation with data-driven projections.
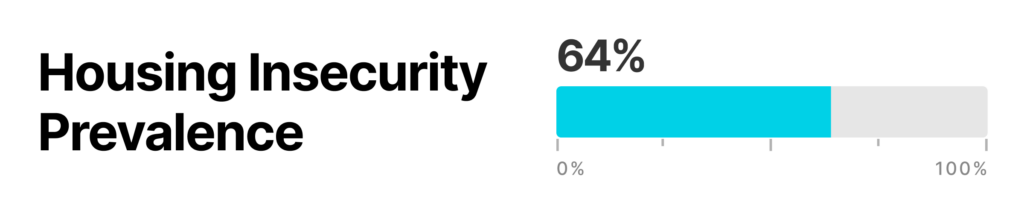
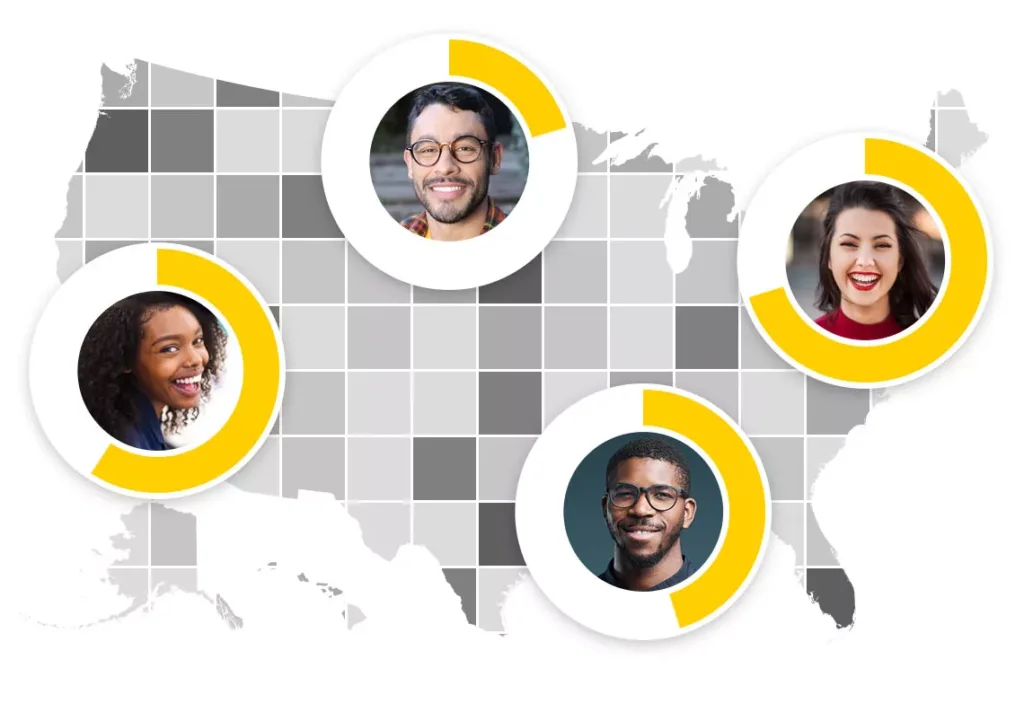
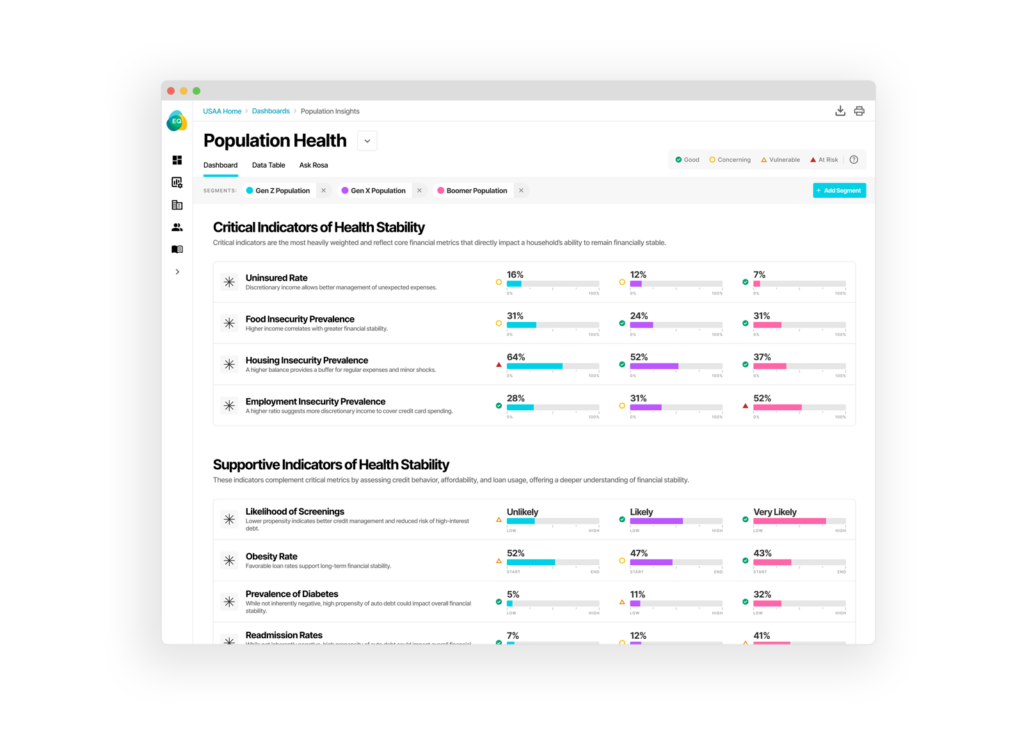
Population Insights
Gain a full 360-degree view of the communities you serve, helping you make informed, strategic decisions.
Impact Tracking
Measure the effectiveness of your programs and investments with real-time, actionable insights.
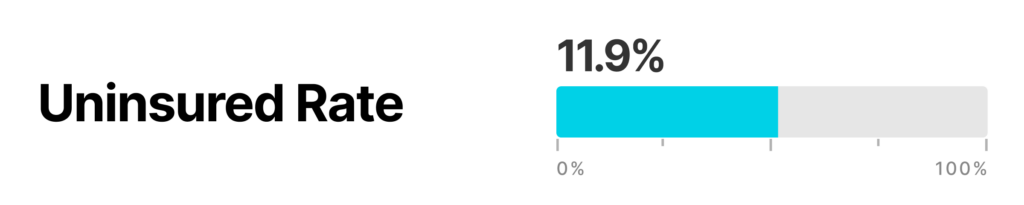
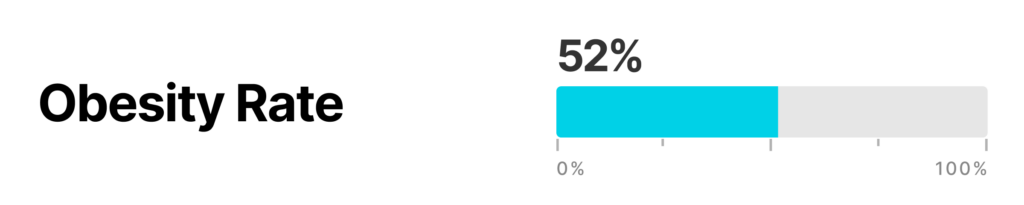
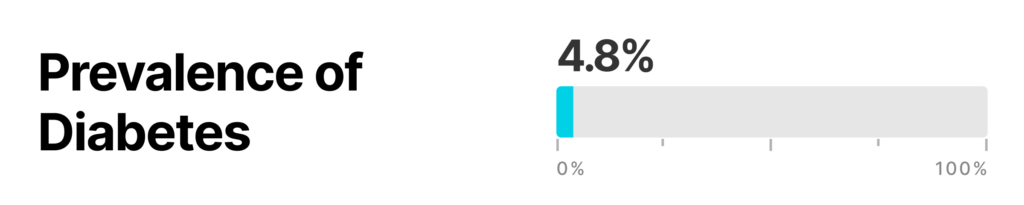
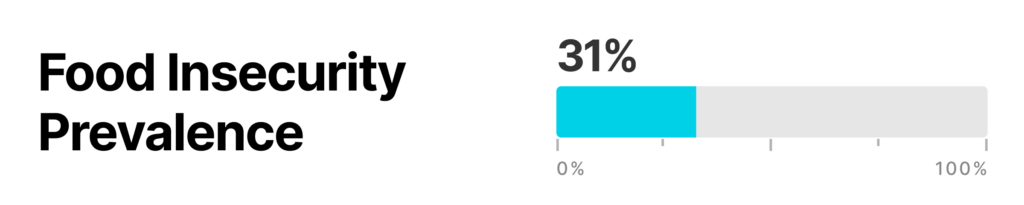
Actionable insights. Real-world results.
We transform data into actionable insights, allowing organizations to understand their communities deeply and drive positive, measurable change.
Who We Serve
We equip stakeholders across the ecosystem with innovative tools and technology.
Hospital Systems
Enhance patient care, optimize quality metrics, and ensure regulatory compliance while streamlining operations for greater efficiency.
Health Plans
Elevate member outcomes, improve STAR ratings, and maximize reimbursements with actionable insights and benchmarking tools.
Non Profits & Foundations
Support public health initiatives, evaluate program success, and address population health needs with equity-focused analytics.
👋
Say hello to Rosa
Rosa is not a real person, but she is the AI smarts behind Equity Quotient. She can help you quickly find data, provide insight, and offer guidance, ideas, and consultation to help turn data into action. Just ask!
Our Founders
Christina Van Houten and Perfecto Sanchez
What started as a hallway conversation between two strangers quickly evolved into a bond over a shared passion to amplify the power of data and technology to solve society’s toughest challenges. Perfecto’s leadership experience driving impact strategy and initiatives for some of the most significant brands combined with Christina’s career leading product strategy for some of the largest enterprise technology companies have made for the perfect combination of skills to bring this shared vision to life.