An AI-powered stakeholder intelligence platform

Dynamic socioeconomic data and insights to better understand your workforce, suppliers, customers, and the communities you operate in.

Image of Equity Quotient's data visualization showing insights for demographic alignment broken down by state and county.
Image of Equity Quotient's data visualization showing insights for demographic alignment
A photo of a smiling minority male.
Photo of a young female minority smiling in an office setting.

Meet Equity Quotient

Start automating your reporting today! Save time and money while optimizing health outcomes and community engagement.

Explore a region's diversity and discover opportunities to drive growth.

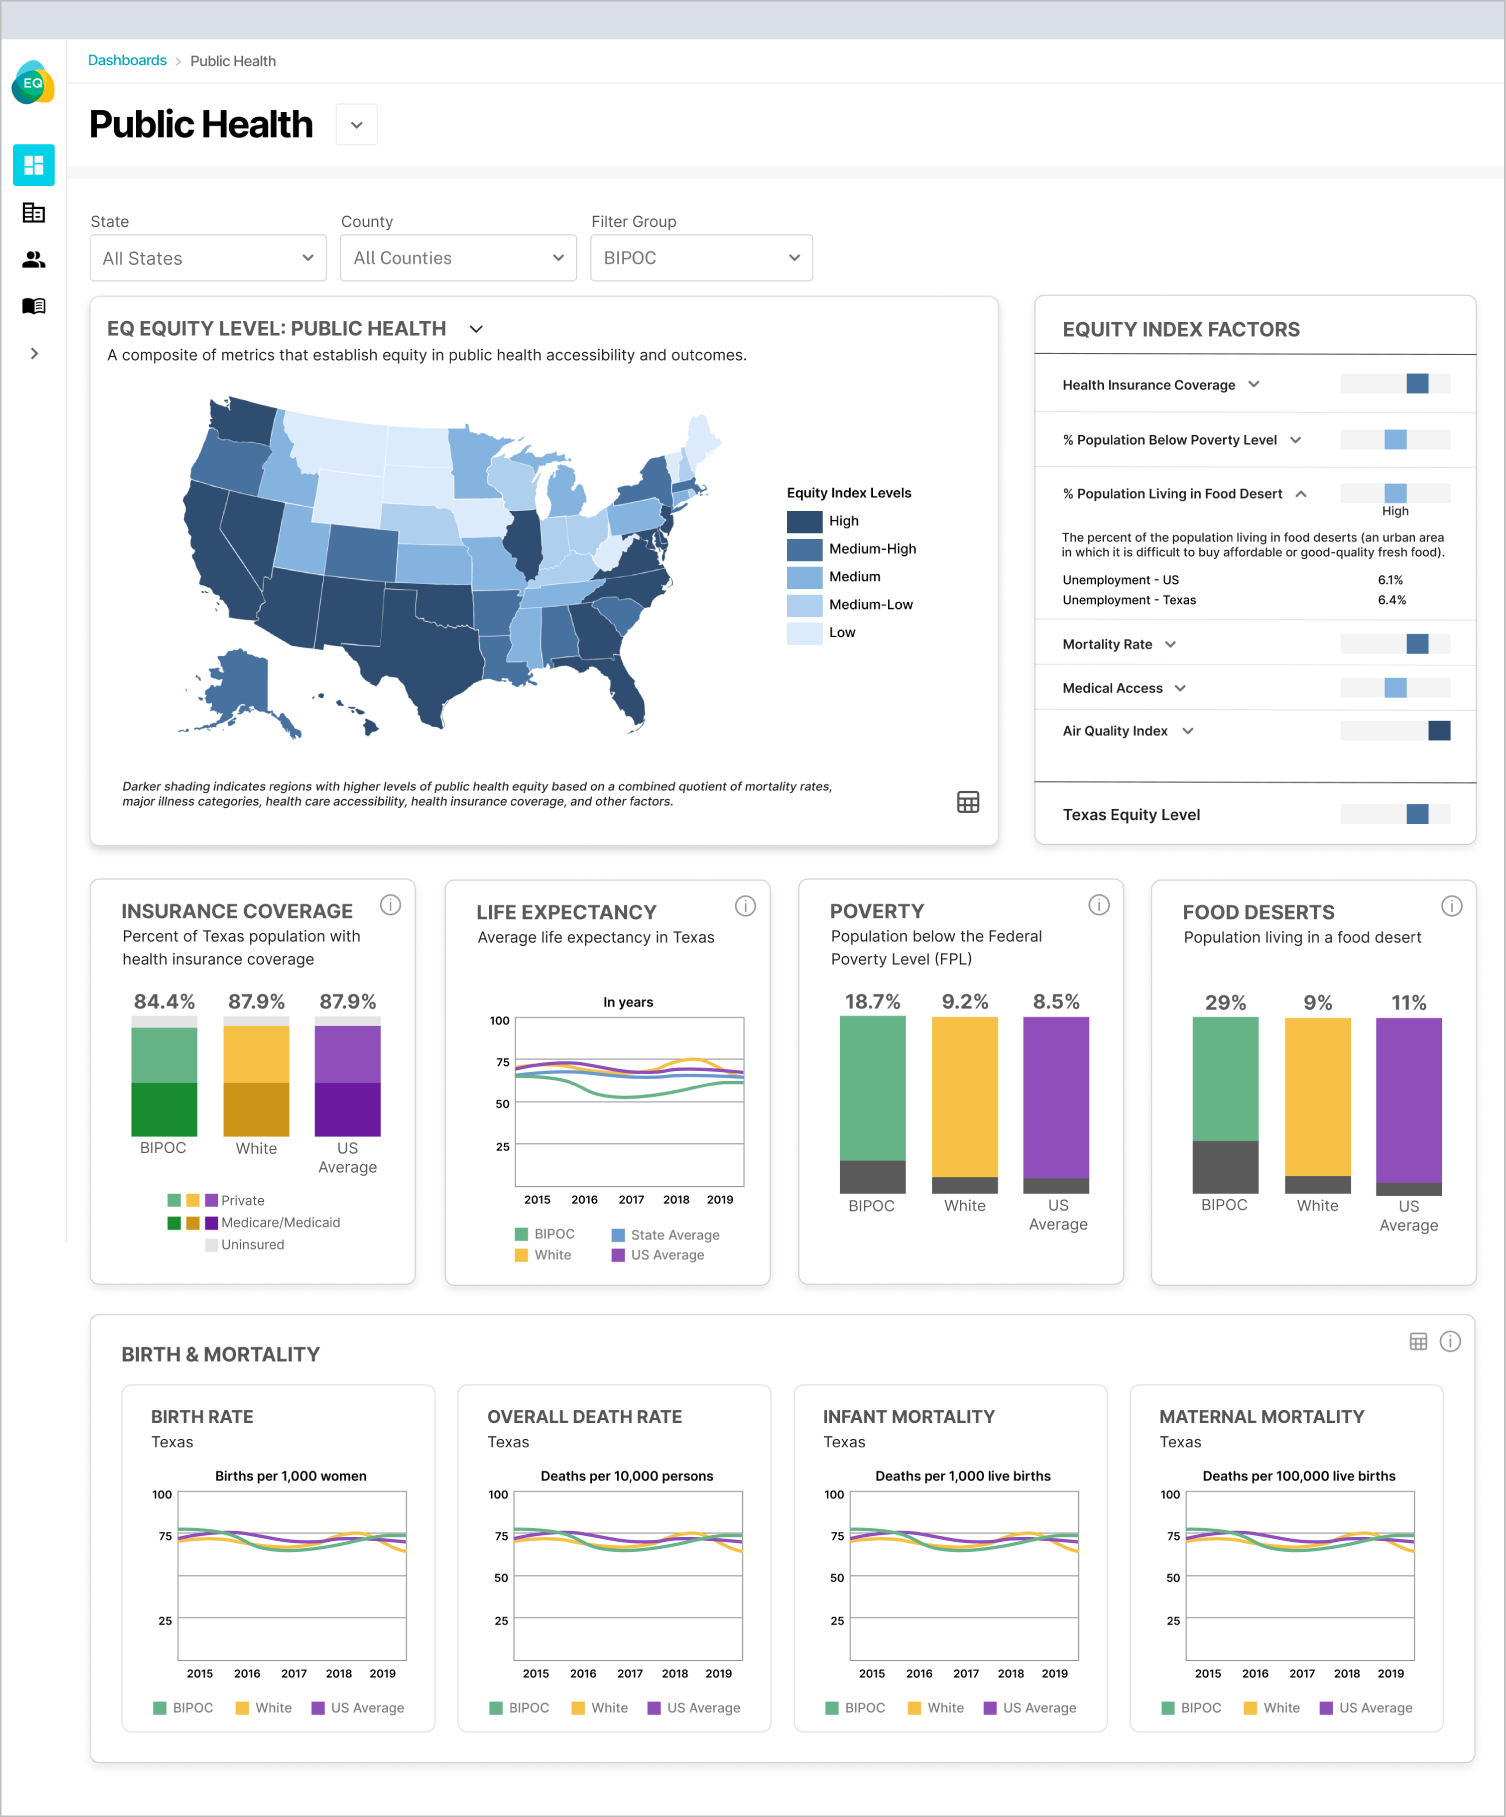
Consider the variation by diversity metrics around social determinants of health.

See key diversity metrics in your focus region
A screenshot of the dashboard of Equity Quotient's data analytics tool called EQ.

An AI-powered stakeholder intelligence platform

Dynamic socioeconomic data and insights to better understand your workforce, suppliers, customers, and the communities you operate in.

Meet Equity Quotient

Easy-to-use dashboards to help you automate compliance, manage risk, and accelerate strategic planning at a fraction of your current spend.

Explore a region's diversity and discover opportunities to drive growth.
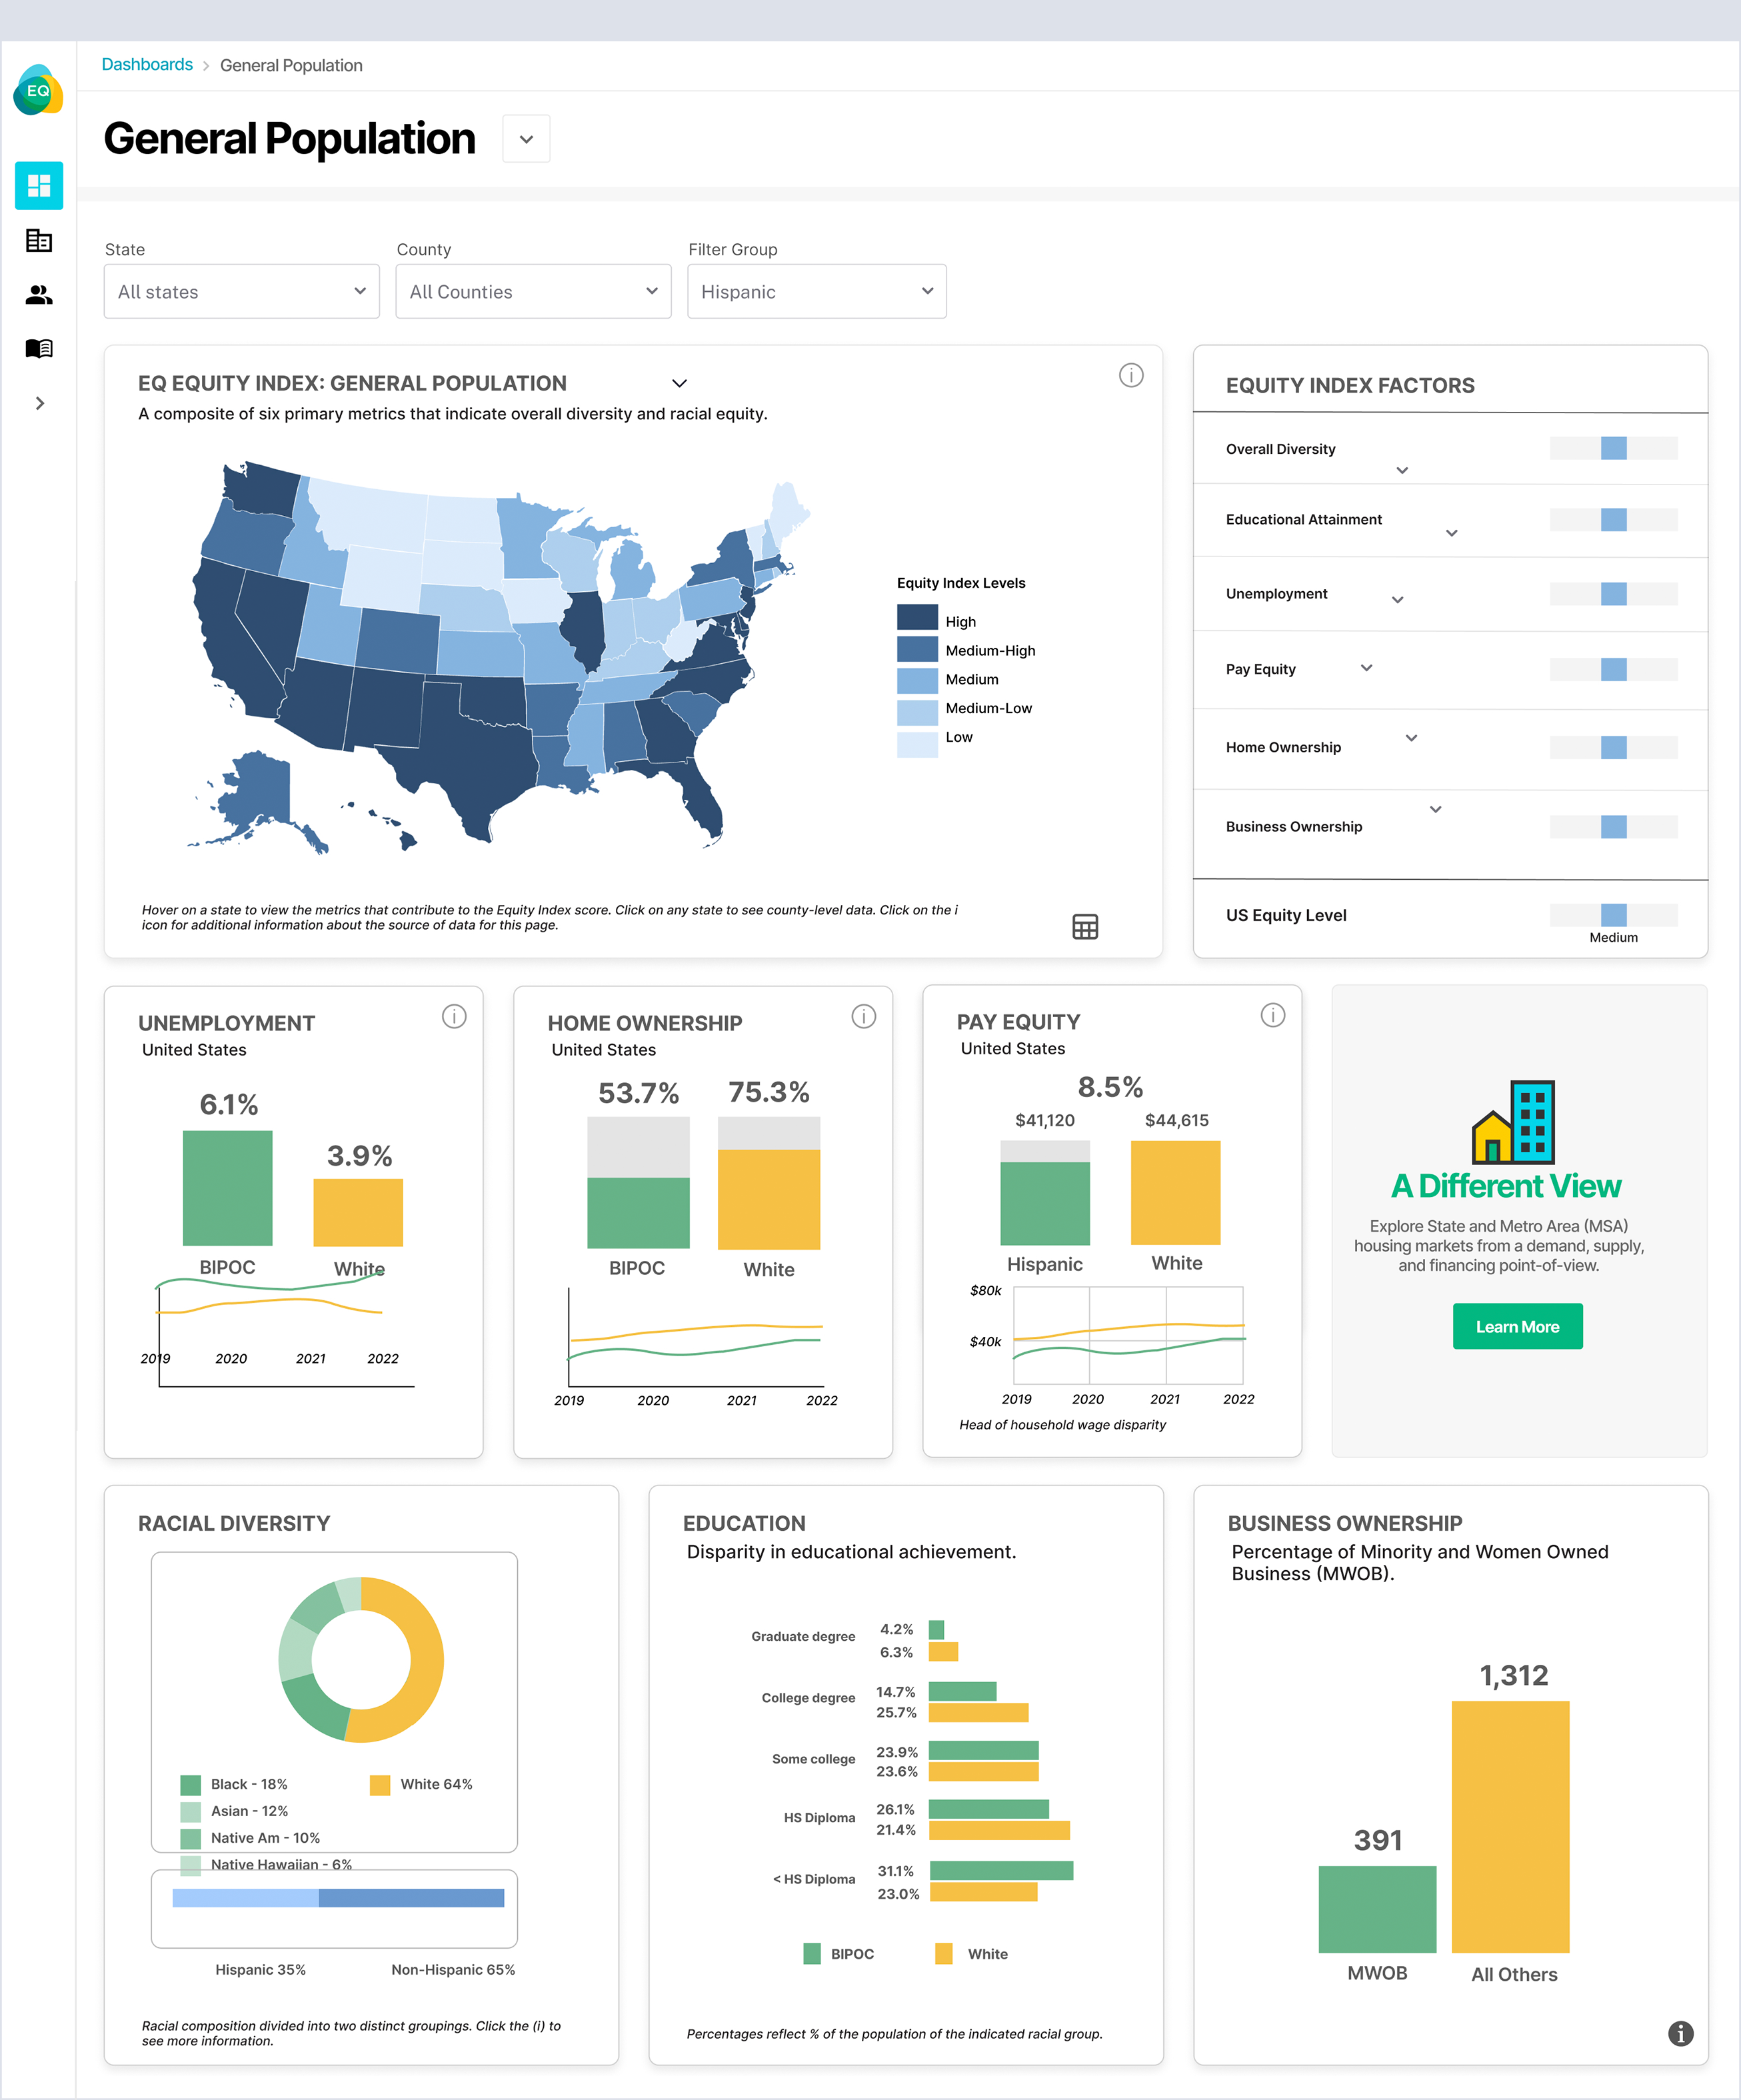
Consider the variation by industry and level of education around diversity metrics.
See key diversity metrics in your focus region
Understand Educational Attainment and Employment by gender and race at a micro-segmented level.
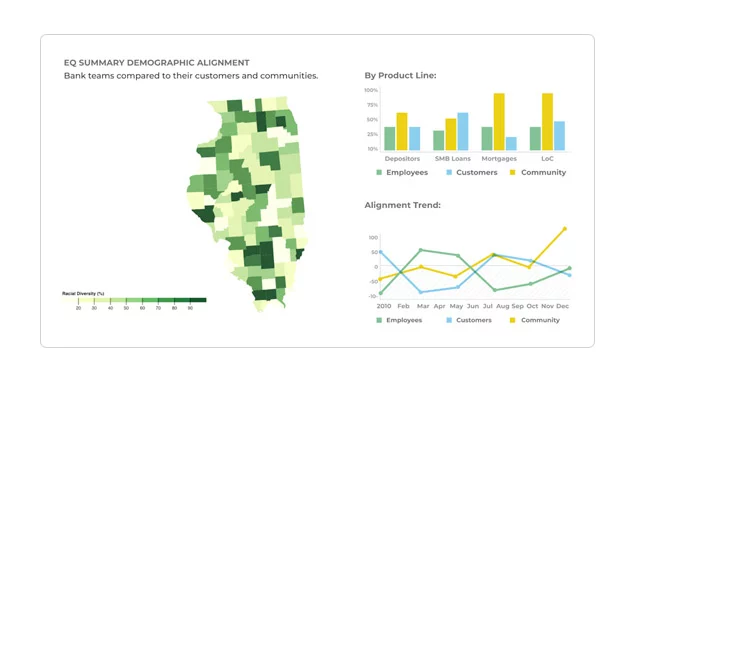
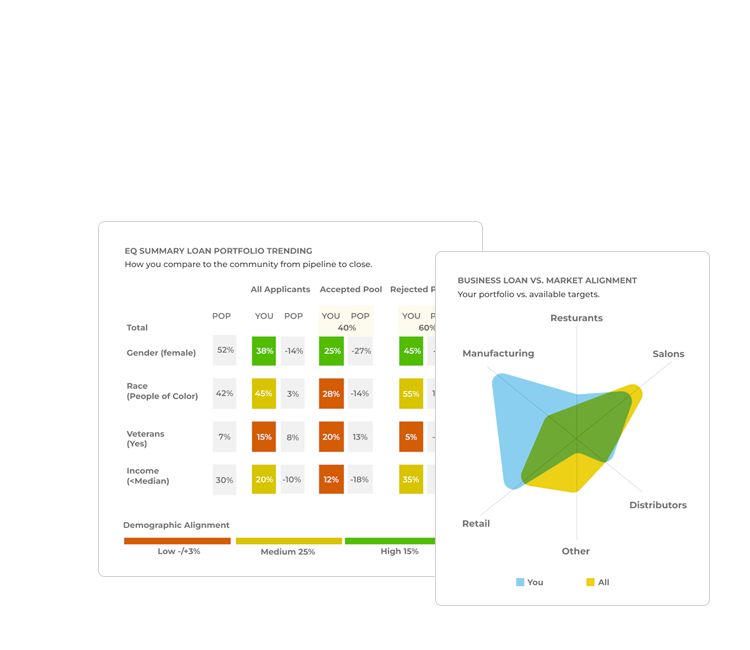
Explore questions you might ask about employees, customers, and suppliers.

Our mission is to inform smarter decisions at the intersection of growth and impact.

An infographic illustrating actionable diversity insights at a national, state and county level

Discover

Explore a wide range of demographic insights and learn how you can optimize your workforce, supplier, customer, and community initiatives.

An infographic illustrating regional demographic comparison

Benchmark

Evaluate how your organization compares to the markets where you operate or communities that you engage.

An infographic illustrating regional demographic outcome growth over time

Grow

Gain access to mission-critical data to power a myriad of important decisions, align teams to execute, and automate disparate reporting requirements.

The future of health equity

How healthcare organizations can address growing challenges in workforce, costs, and regulatory compliance through data-driven solutions that lead to better outcomes and address socioeconomic disparities

Equity Quotient Logo

Case Studies

Select your industry to discover how Equity Quotient’s AI-powered stakeholder intelligence platform can provide concrete, actionable insights to automate compliance, manage risk, and drive growth.

👋

Say Hello to Rosa

Rosa is not a real person, but she is the AI smarts behind Equity Quotient. She can help you quickly find data, provide insight, and offer guidance, ideas, and consultation to help turn data into action. Just ask!

Beta Access

Humanizing data. Catalyzing growth.

We increase access to socioeconomic data to shape a thriving economy inclusive of the people that drive it.

Humanizing data. Catalyzing growth.

We increase access to socioeconomic data to shape a thriving economy inclusive of the people that drive it.