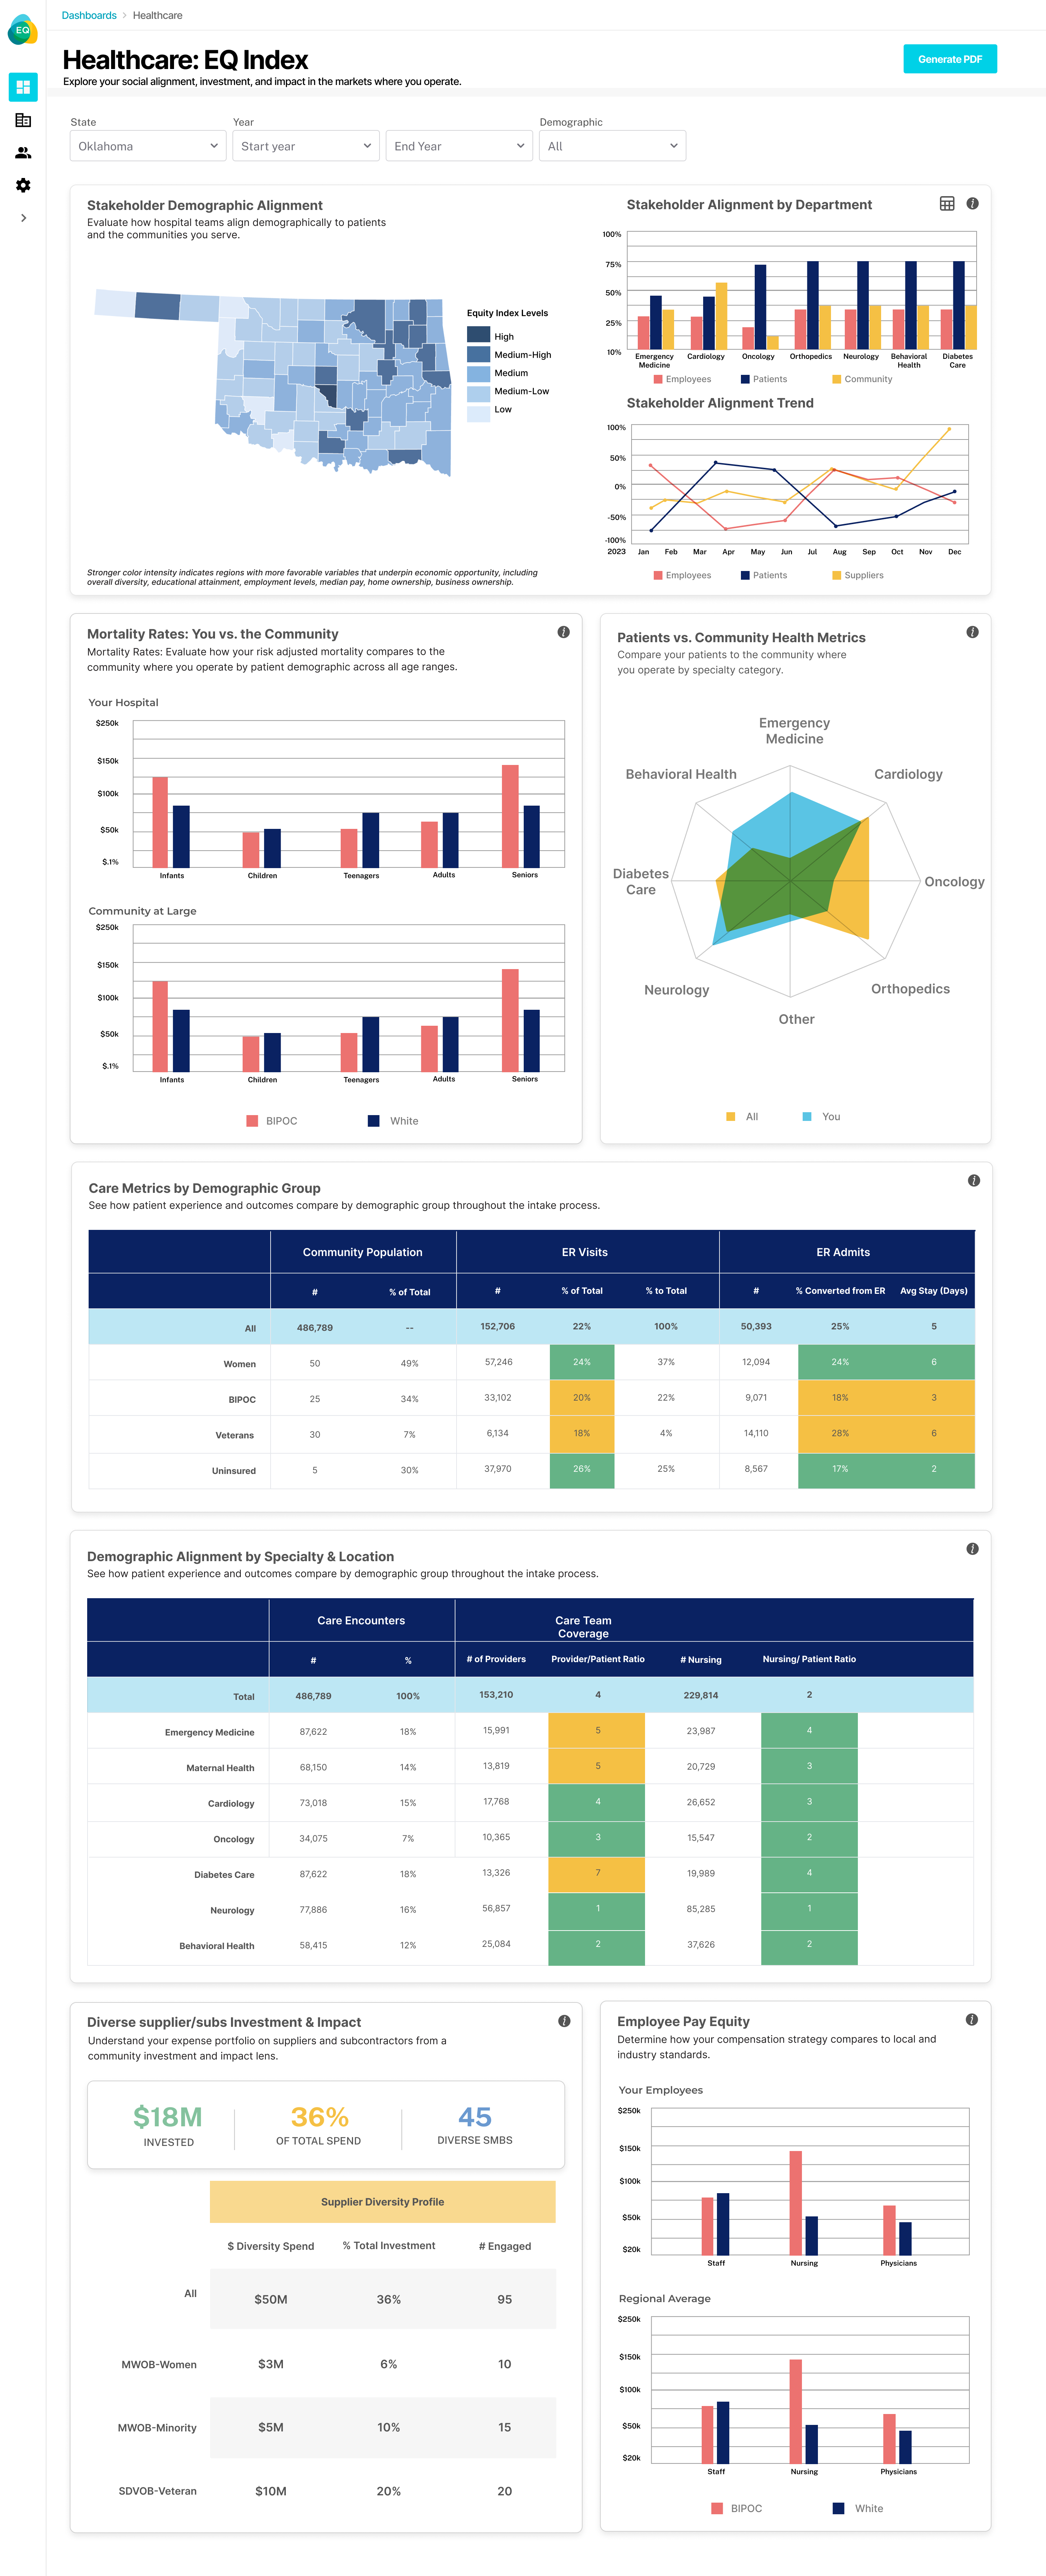
Compare the demographic makeup of your care team, staff, and suppliers to patients and the general population in your area of operations.
Explore your demographic makeup across stakeholder groups (Employees / Patients / Community) for each specialty area.
Baseline the progress of your EQ S-factor over time relative to your strategic and health equity objectives.
Better impact your hospital's mortality rate through stronger demographic alignment between your care teams and the patients they serve.
Unpack how your patient makeup compares to the public health challenges of your region by department.
Evaluate your patient journey and how it varies through a demographic lens, discovering where bias might be impacting patient satisfaction, care costs, and health outcomes.
Match the supply of care to the demand for care by specialty area from a demographic standpoint for each micro-region and help focus strategic imperatives.
Be intentional about your procurement strategy and achieve a more cost-effective and resilient supply chain ecosystem.
Prioritize the diversity of your healthcare/biotech teams and better understand how pay equity across demographic groups can impact talent acquisition and retention.
Compare the demographic makeup of your care team, staff, and suppliers to patients and the general population in your area of operations.
Explore your demographic makeup across stakeholder groups (Employees / Patients / Community) for each specialty area.
Baseline the progress of your EQ S-factor over time relative to your strategic and health equity objectives.
Better impact your hospital's mortality rate through stronger demographic alignment between your care teams and the patients they serve.
Unpack how your patient makeup compares to the public health challenges of your region by department.
Evaluate your patient journey and how it varies through a demographic lens, discovering where bias might be impacting patient satisfaction, care costs, and health outcomes.
Match the supply of care to the demand for care by specialty area from a demographic standpoint for each micro-region and help focus strategic imperatives.
Be intentional about your procurement strategy and achieve a more cost-effective and resilient supply chain ecosystem.
Prioritize the diversity of your retail banking teams and better understand how pay equity across demographic groups can impact talent acquisition and retention.