Equity Quotient is an AI-powered stakeholder intelligence platform. We increase access to socioeconomic data to help you better understand your workforce, suppliers, customers, and community.
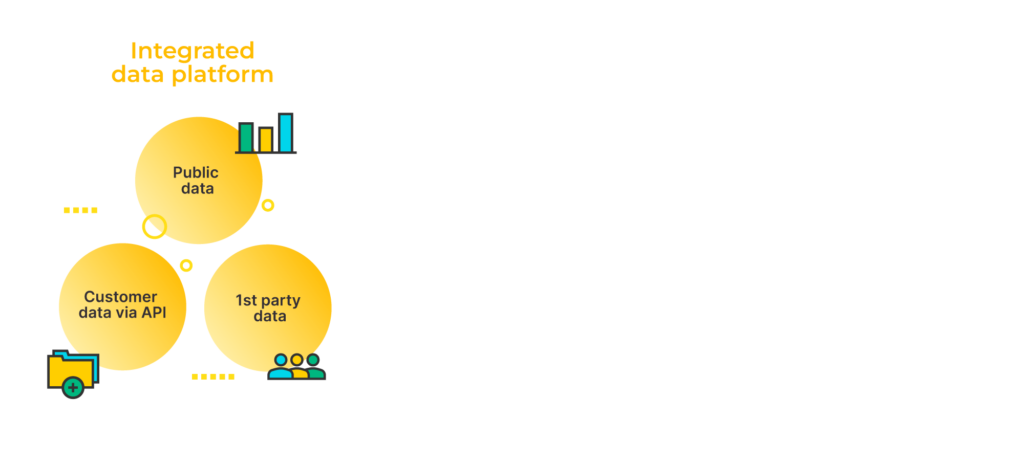
Access rich data from public, private, and 1st party sources.
Intersected into an insights platform to achieve AI-powered analytics focused on highlighting business risk and growth opportunities.
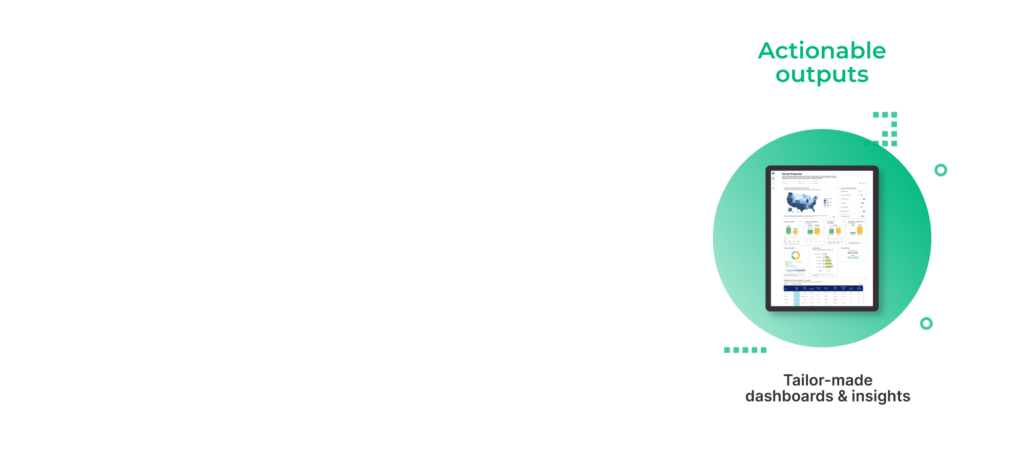
Discover deep insights using our suite of expert dashboards.
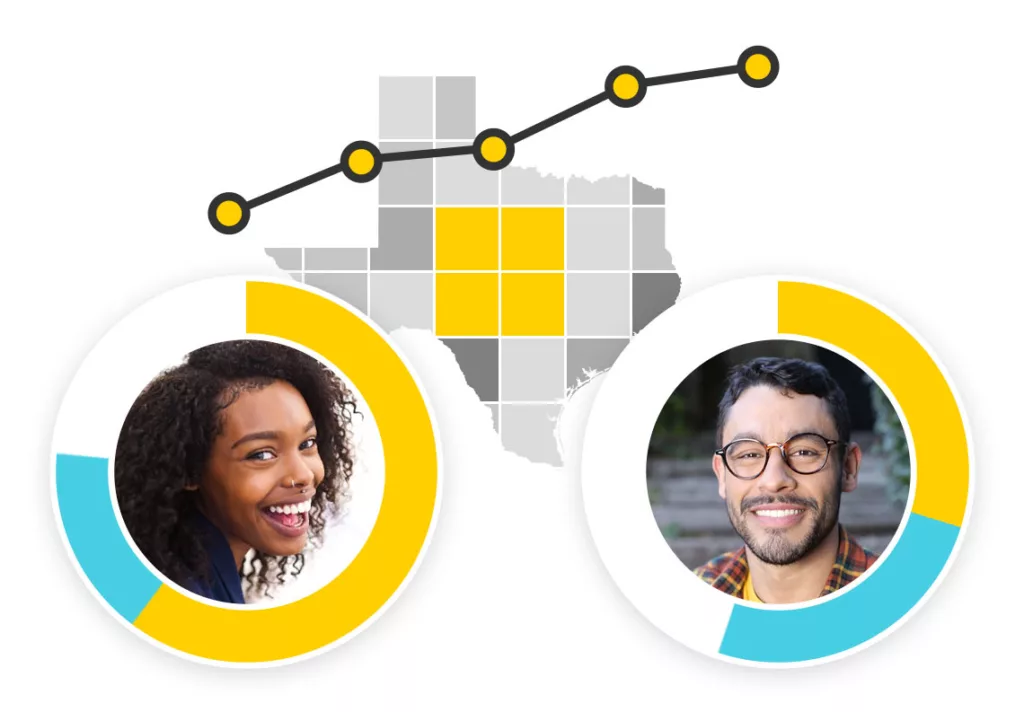
Choose region, industry, and other demographic variables to fit business objectives. Explore data and analytics at a national, state, or county level.
Compare and benchmark your goals to the markets where you operate.
Evaluate how your organization compares to surrounding region(s). Benchmark your efforts and measure business initiatives, performance, and impact.
Shape outcomes and unlock growth with actionable insights.
Save time and money by streamlining reporting across cross-functional teams to automate compliance, mitigate risk, and improve financial performance.
Product Dashboards
Explore our suite of dashboards, each curated to provide actionable insights across various sectors and topics to help you get a deeper understanding of your customers, suppliers, employees, and community to catalyze growth.
By harnessing the power of emerging AI-related capabilities, Equity Quotient stands at the forefront of leveraging technology to drive positive change. Our innovative creation of a large language model through natural language processing, combined with the use of machine learning to achieve predictive modeling, interactive visualization, and personalized recommendations, will set us apart in the market. These capabilities will empower organizations to make data-driven decisions that manage the risk of adverse stakeholder impact while achieving more equitable, sustainable growth.