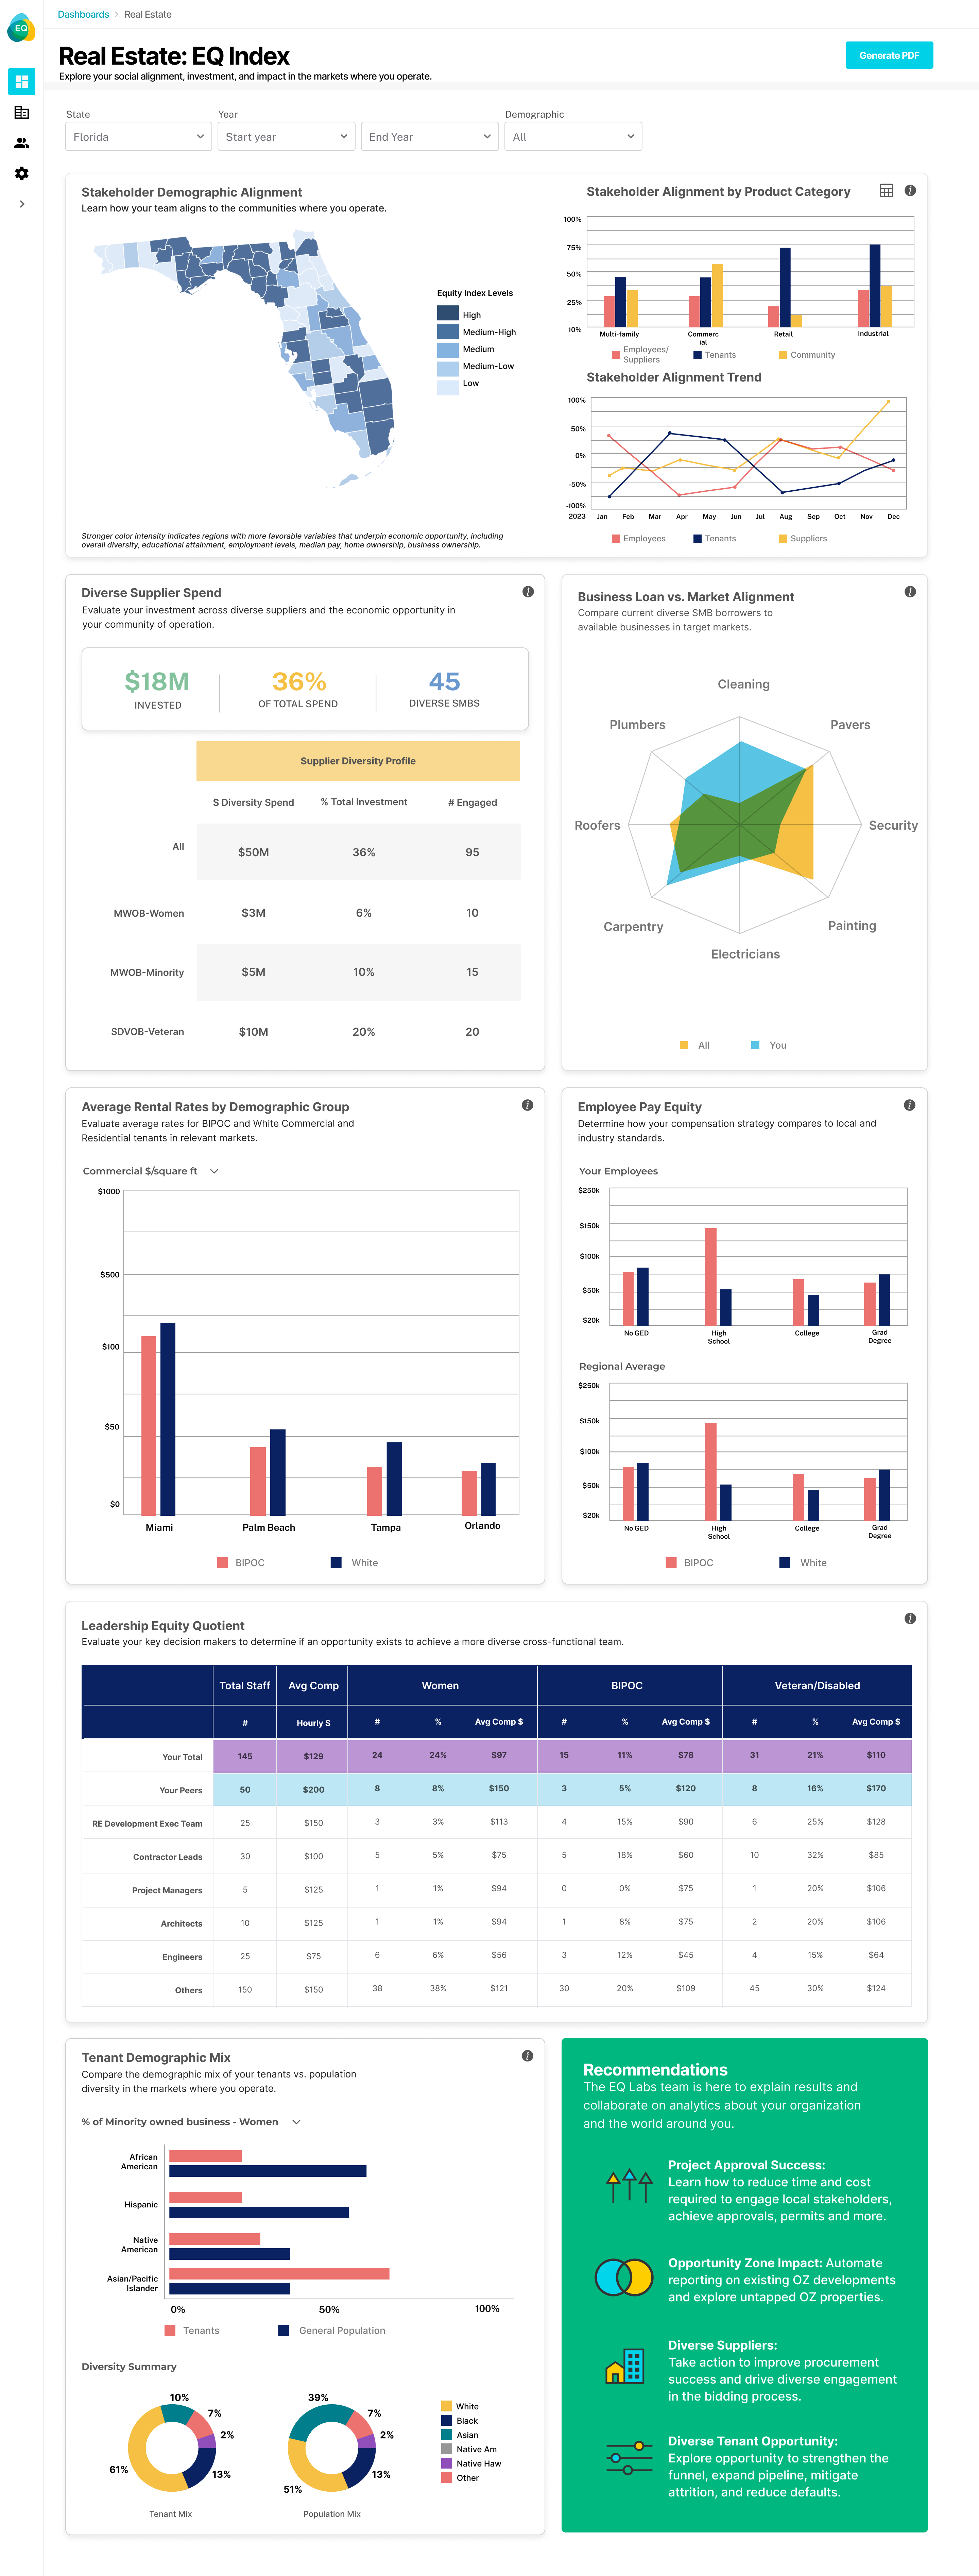
Compare the demographic makeup of your teams, staff and suppliers to your area of operations and learn how to best impact tenant attrition and default rates.
Segment your demographic makeup by stakeholder group (Employees / Suppliers / Tenants / Community) by asset class.
Baseline the progress of your EQ S-factor over time, relative to your strategic imperatives.
Be intentional about your procurement strategy and achieve a more a cost-effective and resilient supplier ecosystem.
Determine how your current portfolio of available suppliers aligns with your local ecosystem of minority & women-owned businesses broken down by key micro-vertical.
Understand where bias exists in your portfolio and how to take action and understand how alignment for your tenants can contribute to key performance and growth objectives.
Prioritize the diversity of your teams across various functional areas to better understand how pay equity across demographic groups can impact talent acquisition and retention.
Track how your team is evolving over time to ensure fresh, innovative perspectives that align to the markets you're targeting.
Understand your tenant mix vs. the populations in your communities can provide important insights into risk and opportunity.