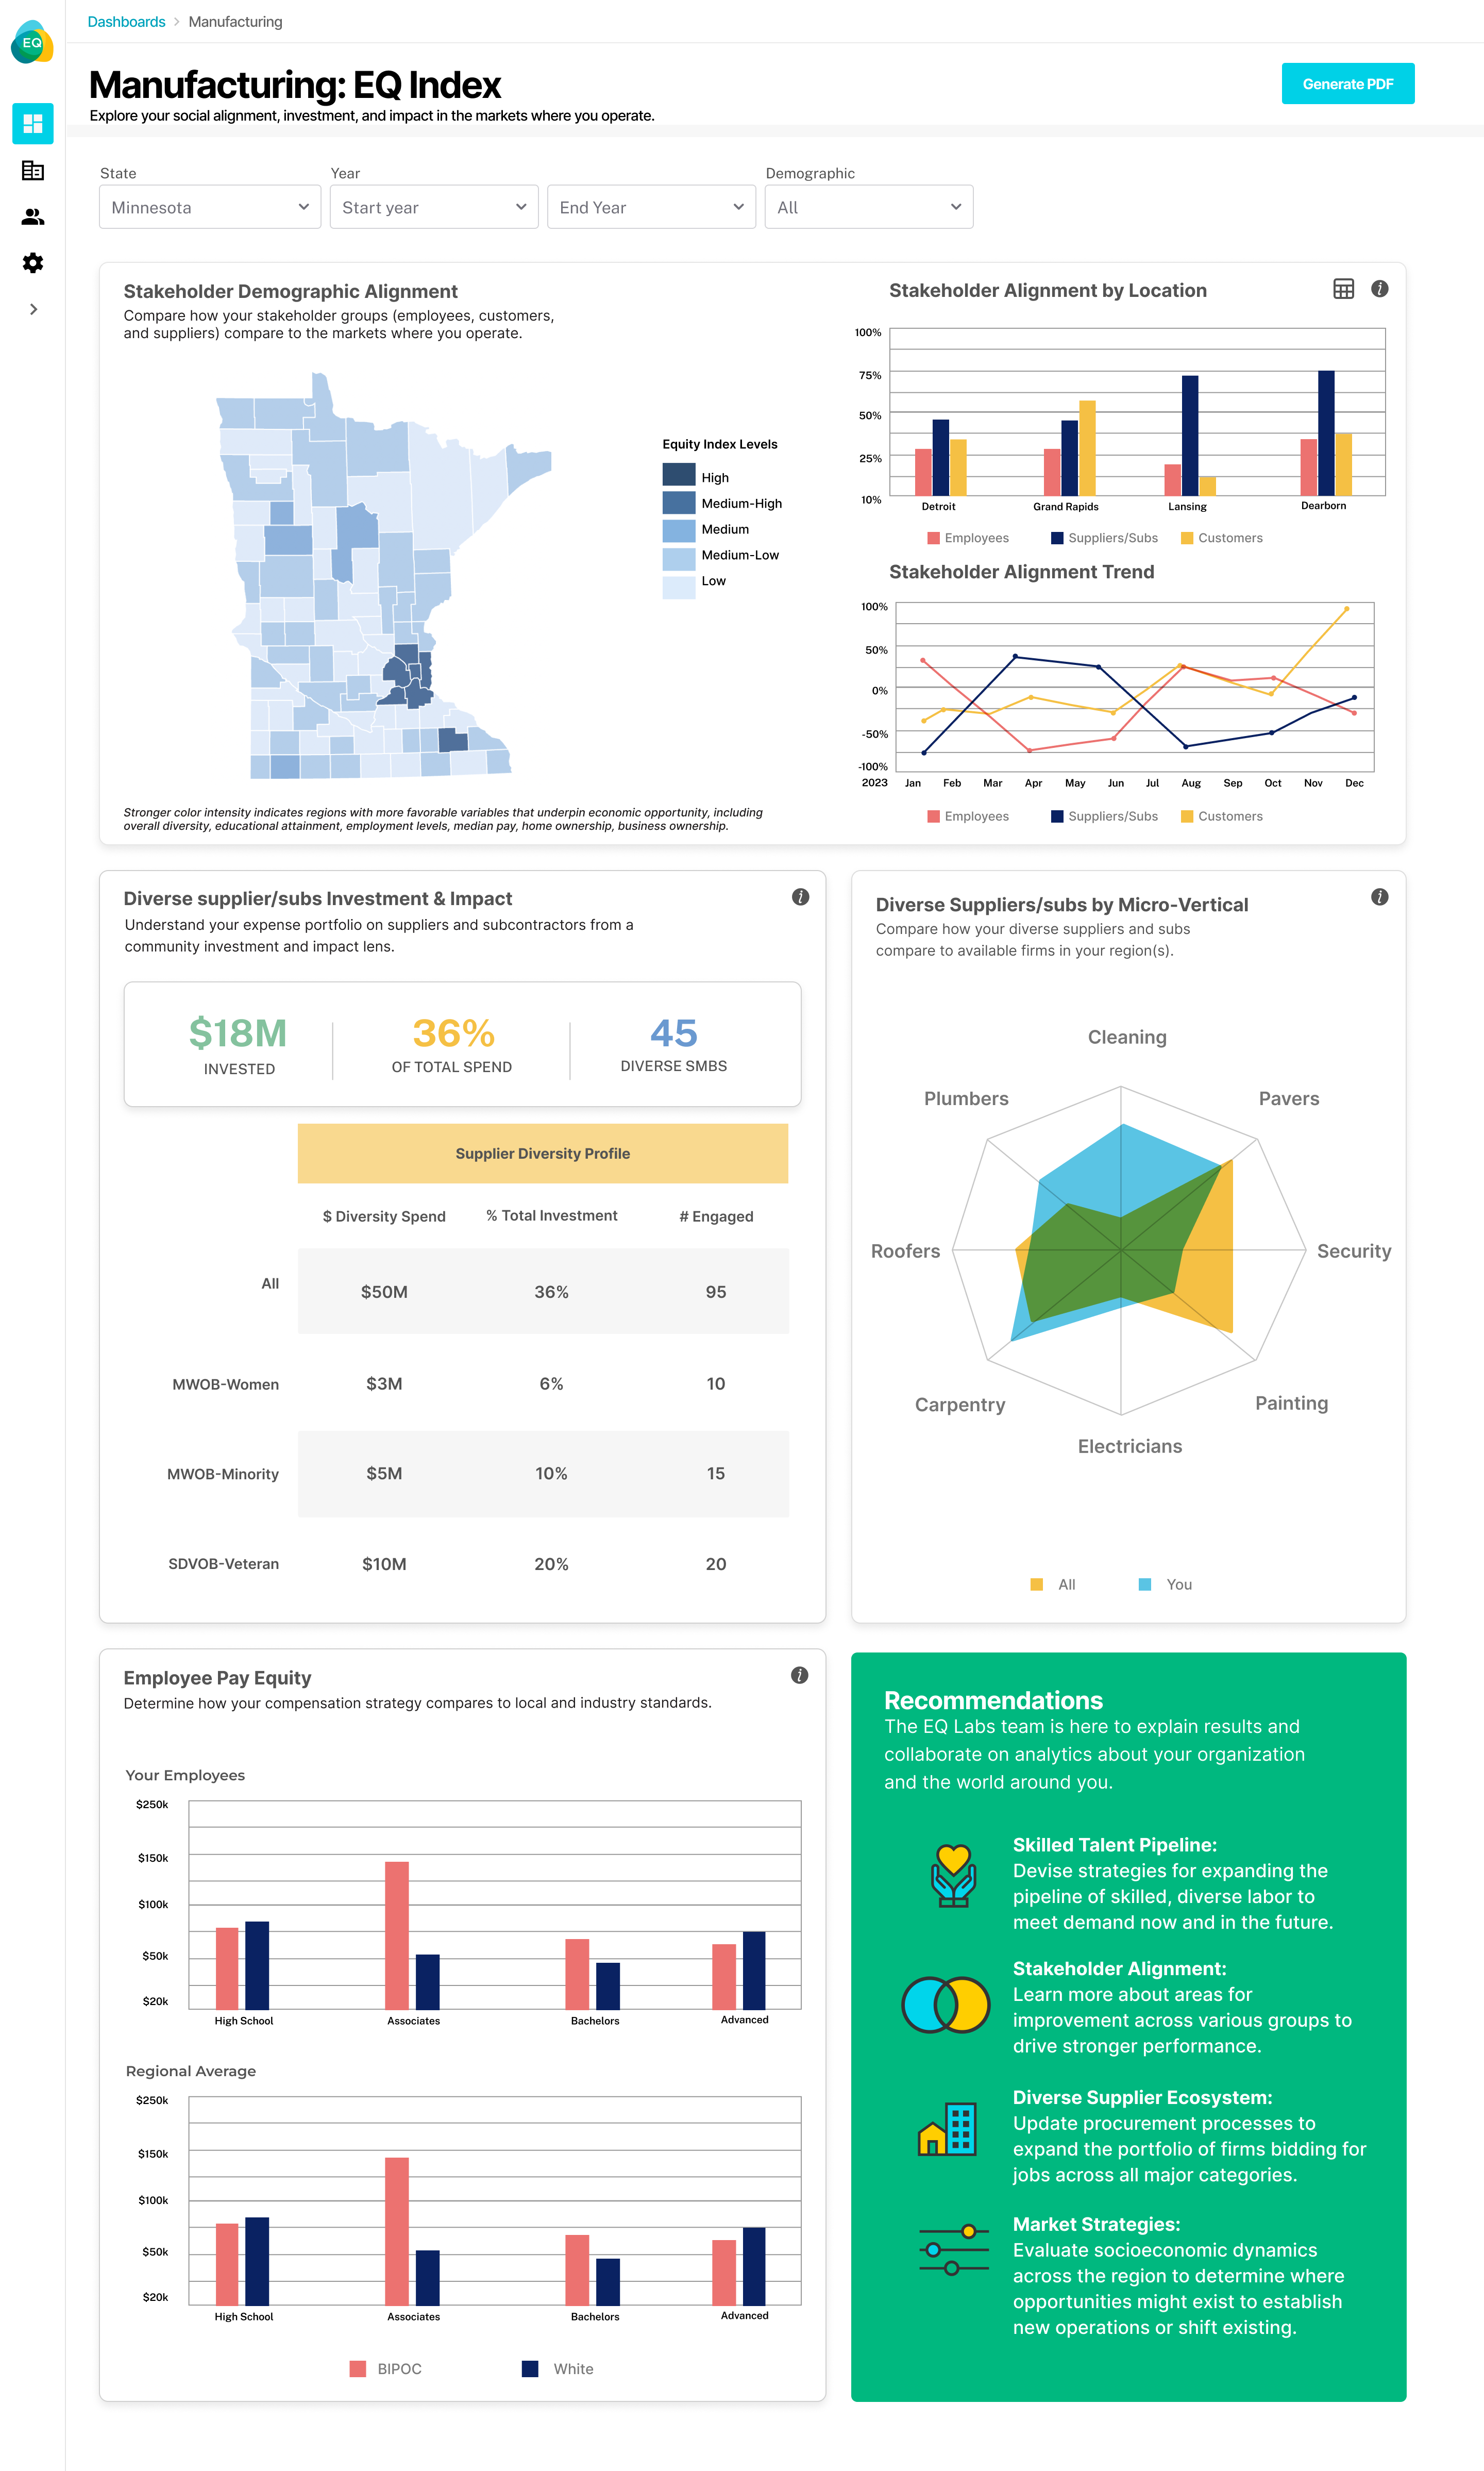
Compare the demographic makeup of your staff and suppliers to your customers and the general population in your area of operations.
Understand your demographic alignment by stakeholder group (employees / suppliers / community) by region to gain actionable insights that can drive factory productivity and unlock growth.
Track how stakeholder communities are evolving relative to each other can provide insight into how well you're aligned to the markets where you operate.
Be intentional about your procurement strategy and achieve a more cost-effective and resilient supply chain ecosystem.
Evaluate your current portfolio of available suppliers by micro-vertical vs. those available in your region to open your procurement processes and reduce cost and risk while improving impact metrics.
Prioritize the diversity of your staff and better understand how pay equity across demographic groups can impact talent acquisition and retention.