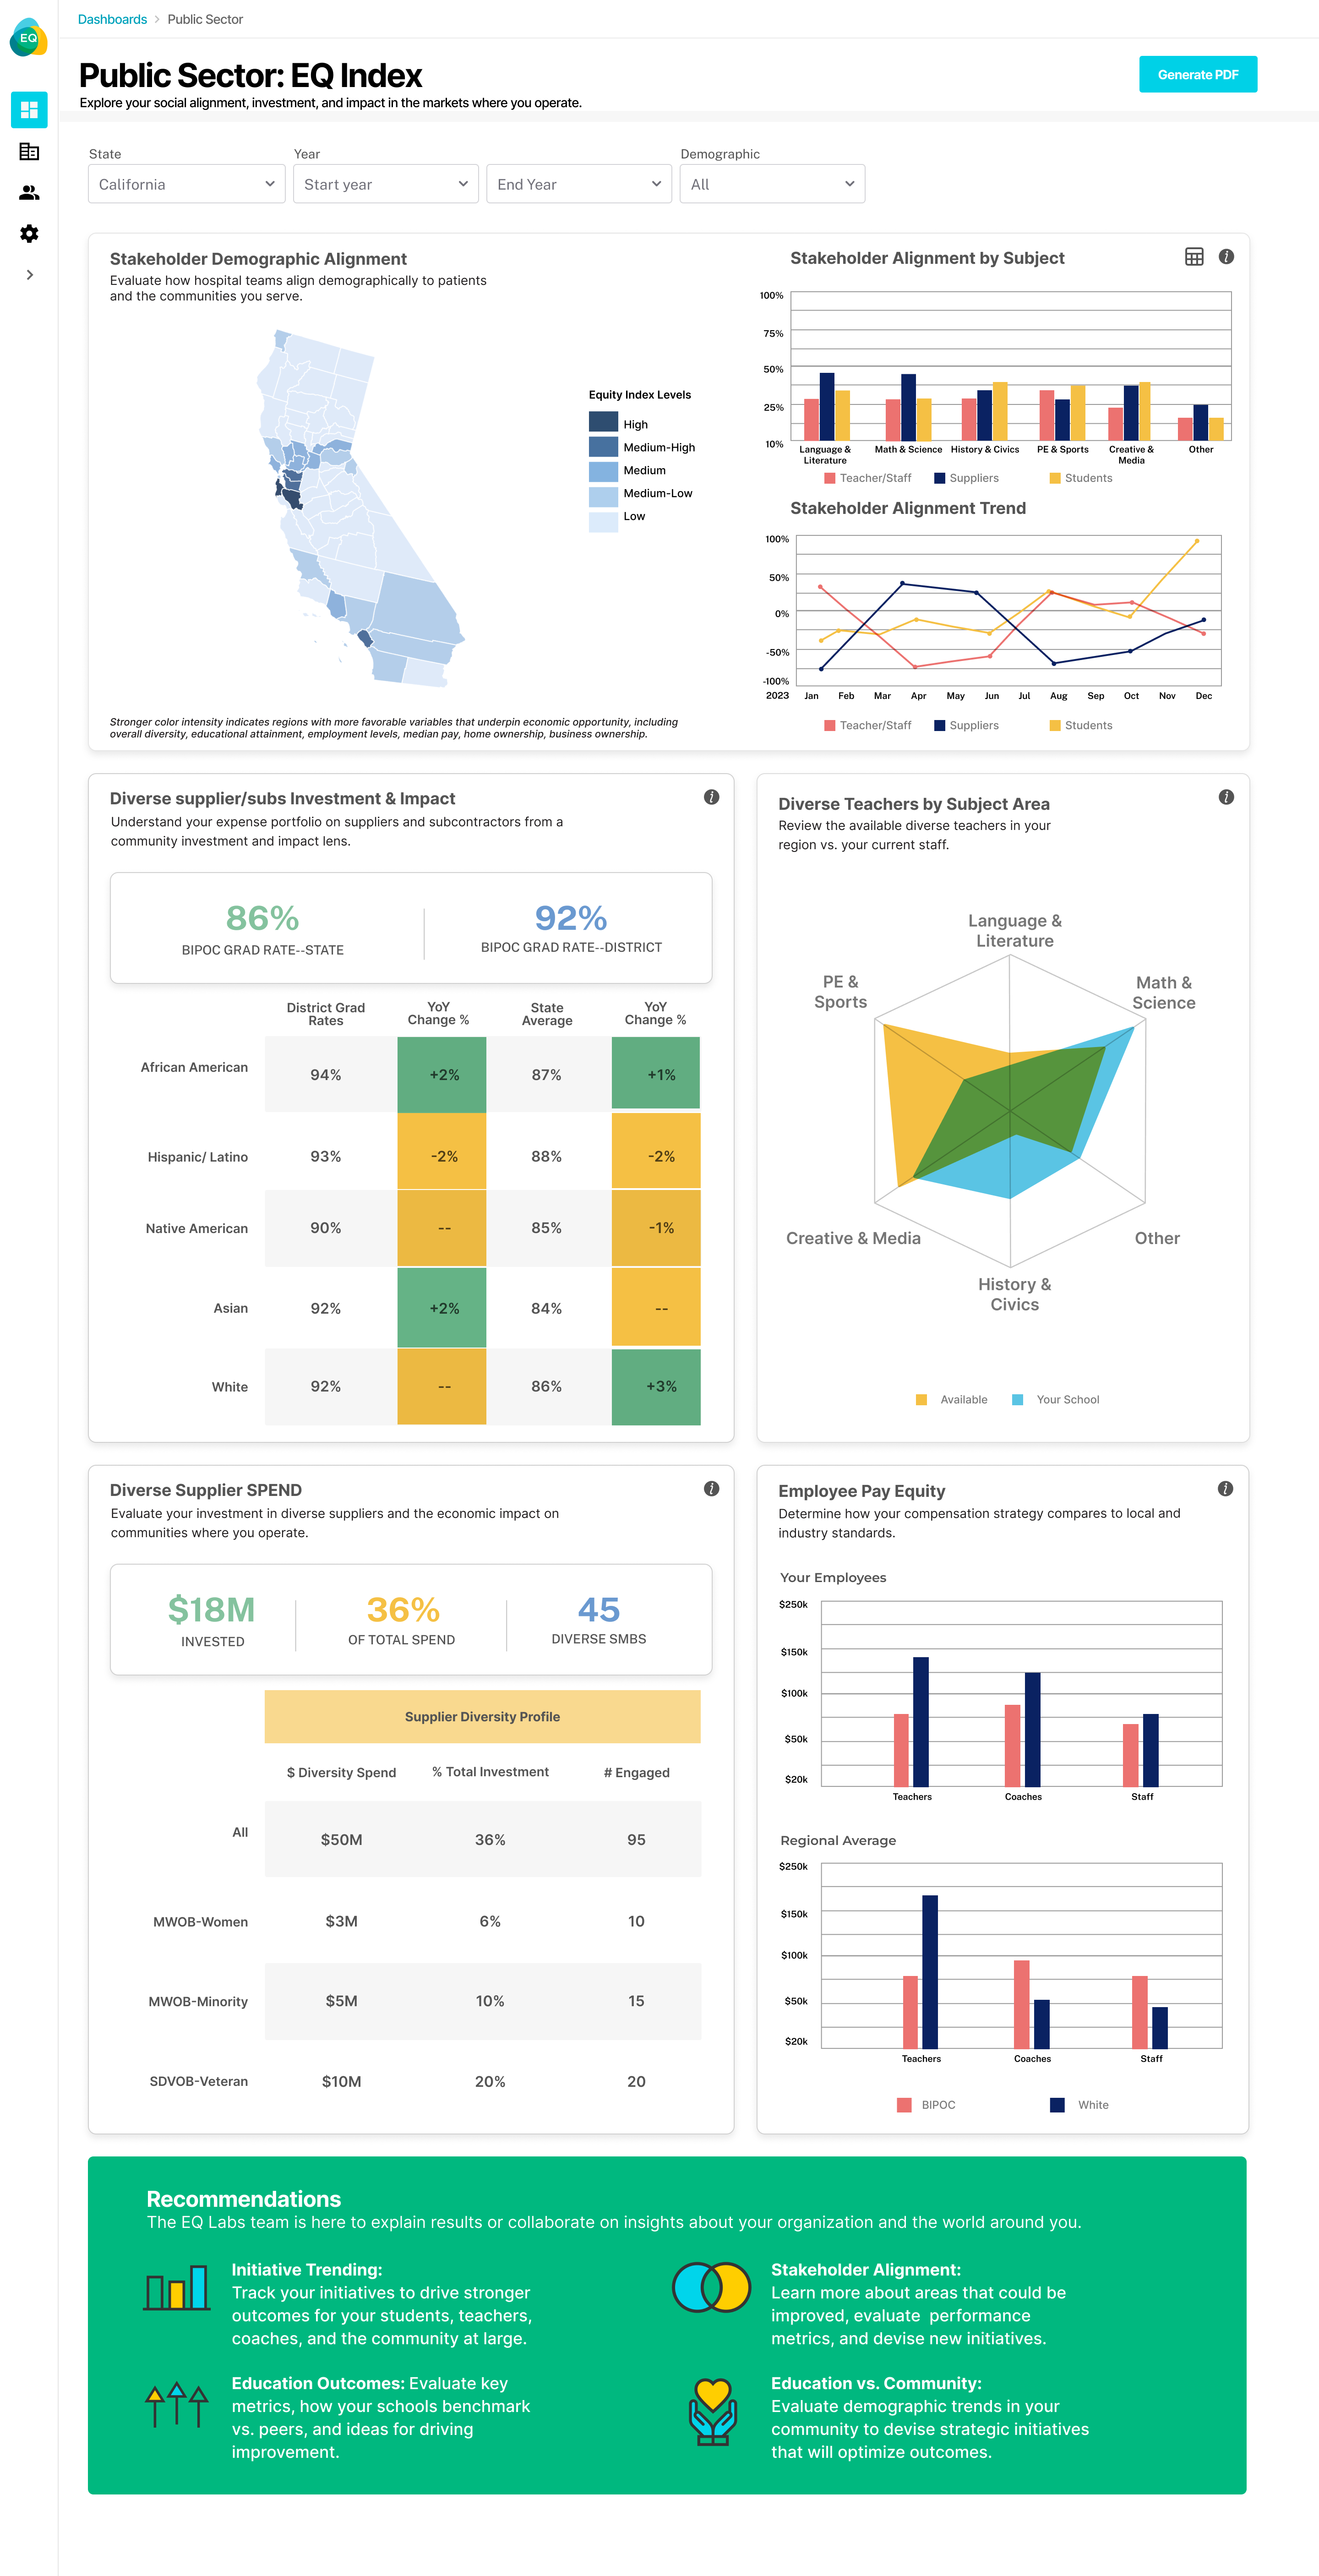
Compare the demographic makeup of your staff to the students in your district.
See a comparison of your demographic alignment across stakeholder groups and by subject matter for more actionable insights into areas that can ultimately improve graduation rates, test scores, and other student outcomes.
Baseline the progress of your EQ S-factor over time, relative to your strategic imperatives.
Evaluate graduation success rates by demographic group for your school vs. averages for the region to determine if outcome metrics can be improved through stronger stakeholder alignment.
Compare the availability of diverse teachers to the population in your region to uncover opportunities for new talent by subject area.
Be intentional about your procurement strategy to achieve a more cost-effective, resilient, and impactful supply chain ecosystem.
Prioritize the diversity of your staff and better understand how pay equity across demographic groups can impact education outcomes.