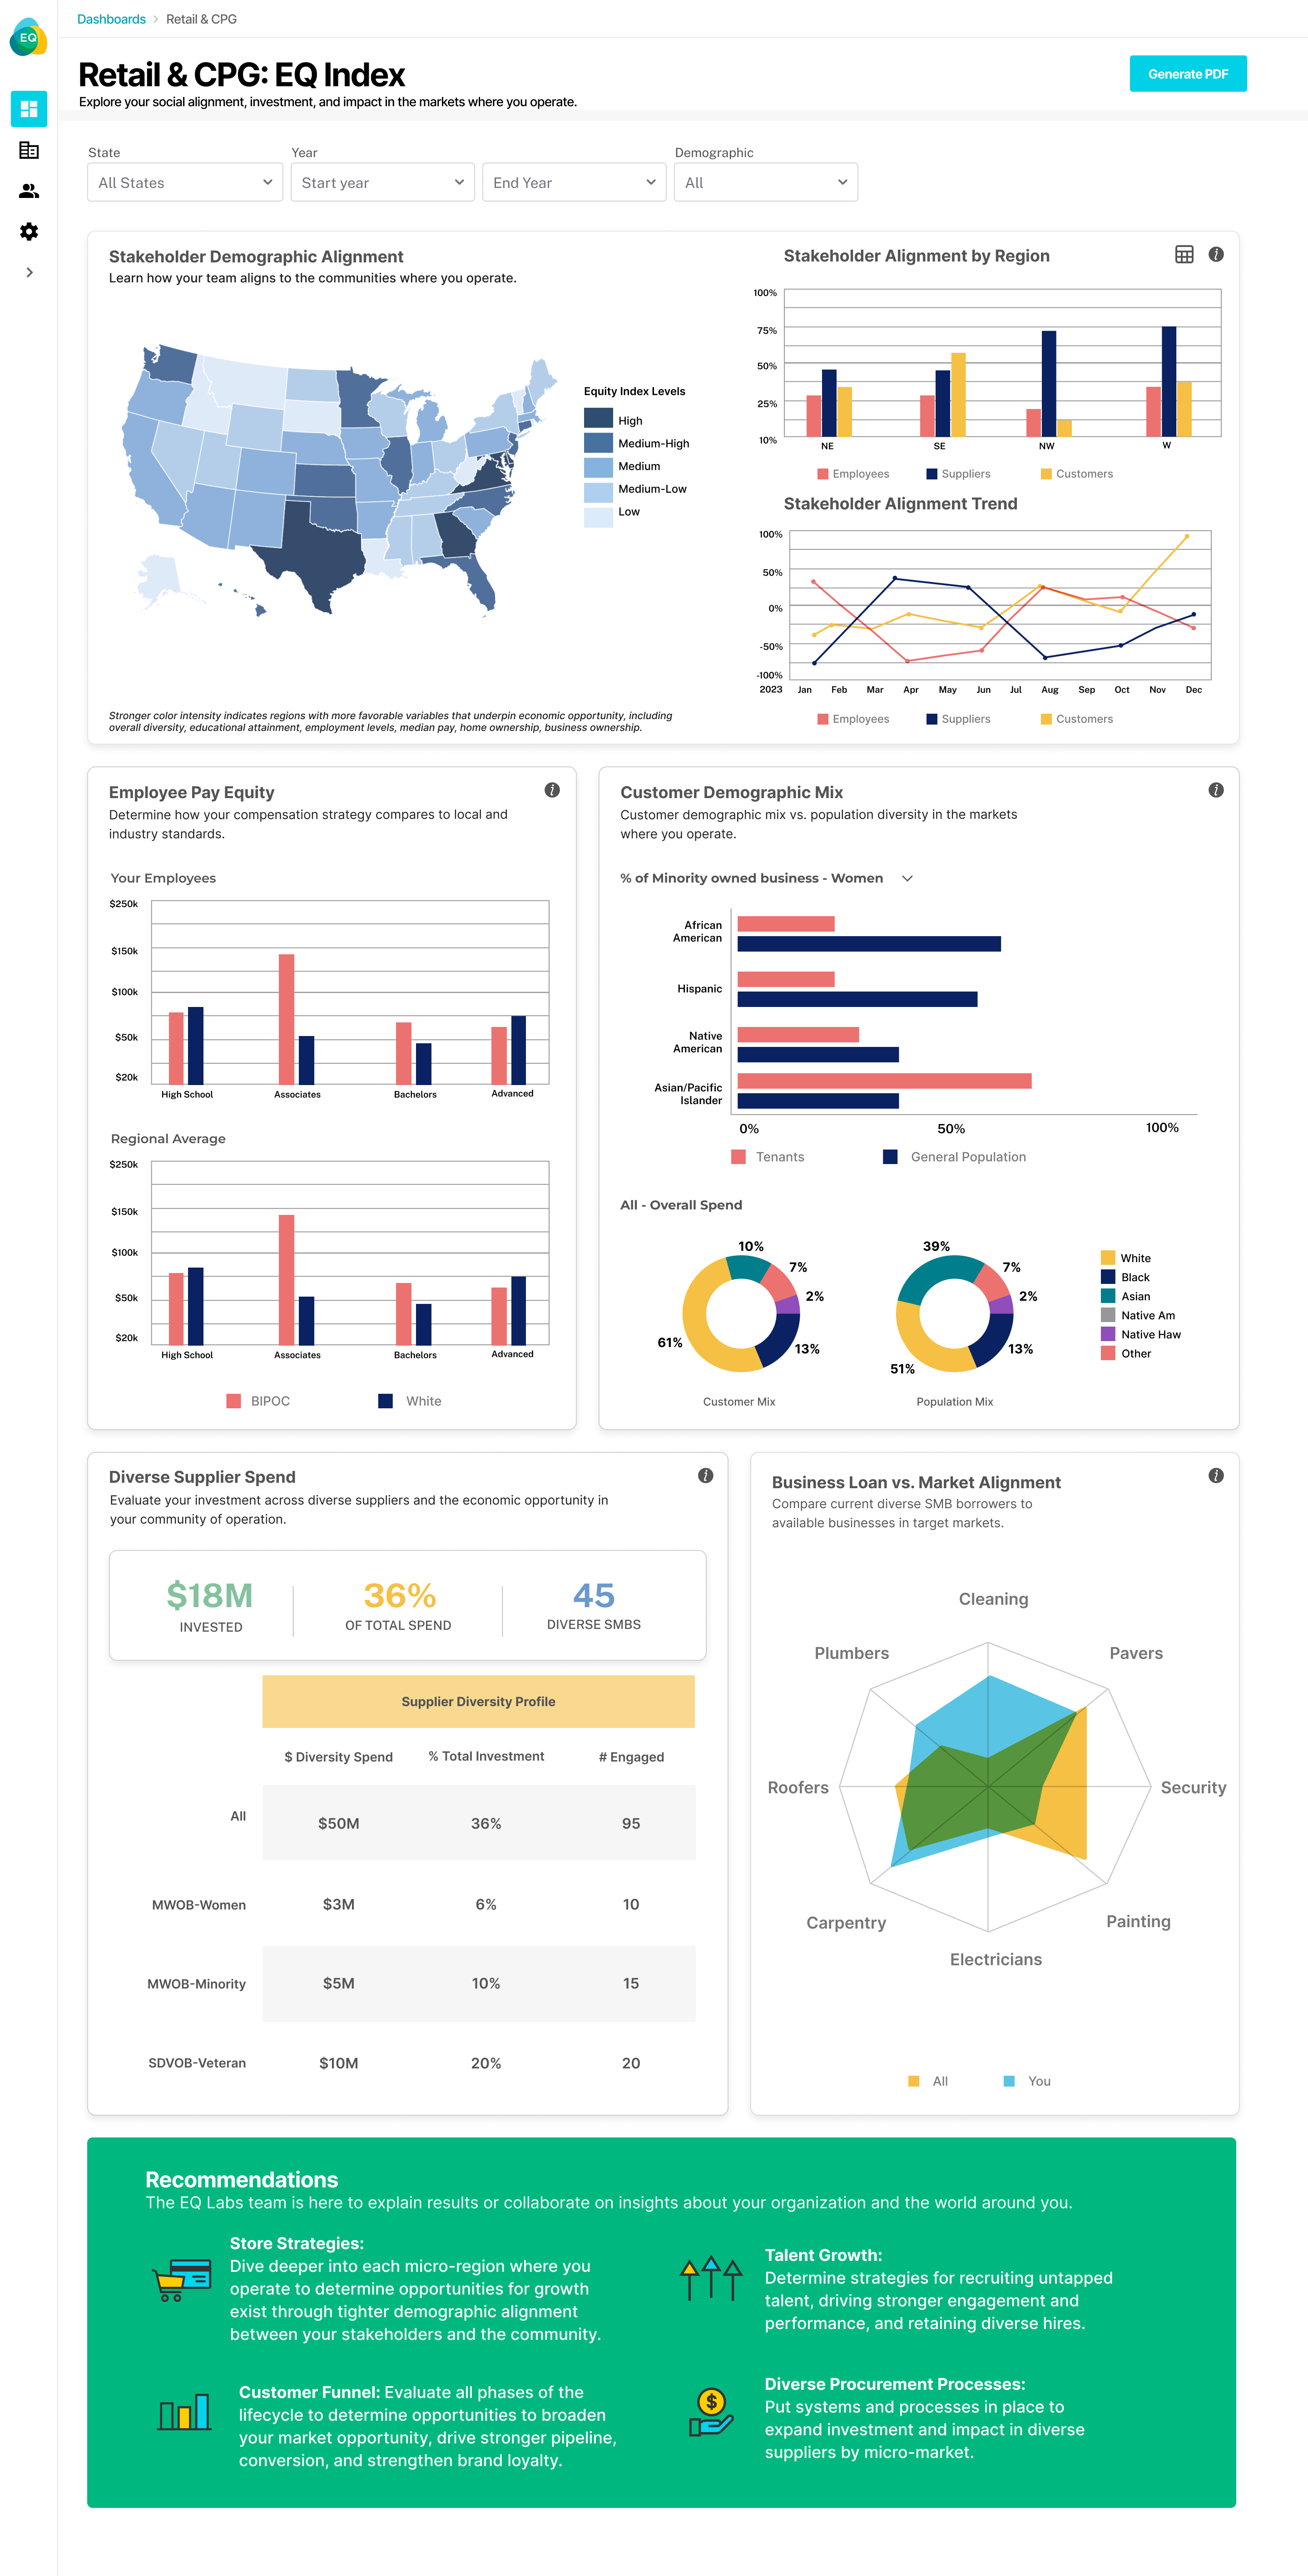
Compare the demographic makeup of your team, staff, and suppliers to your customers and general population in your area of operations.
Understand the demographic makeup of your stakeholder groups (Employees / Suppliers / Customers / Community) by region.
Baseline the progress of your EQ S-factor over time relative to your strategic imperatives.
Prioritize the diversity of your retail teams and better understand how pay equity across demographic groups can impact talent acquisition and retention.
Understand your customer mix vs. the population in your communities to gain important insights into risk and opportunity.
Be intentional about your procurement strategy to achieve a more cost-effective and resilient supply chain ecosystem.
Unpack how your current portfolio of available suppliers aligns with your local ecosystem of minority & women-owned businesses broken down by micro-vertical.