Skip to content
Equity Quotient logo
  • Our Product
    • Our Product

      EQ delivers data and analytics to companies to help them unlock growth and drive stakeholder impact.

      See How it Works
    • Product Dashboards

      • General Population Dashboard
      • Housing Market Dashboard
      • Mortgage Access Dashboard
      • Business Landscape Dashboard
      • Public Health Dashboard
      • Workforce Diversity Dashboard
      • Supplier Diversity Dashboard
      • General Population Dashboard
      • Housing Market Dashboard
      • Mortgage Access Dashboard
      • Business Landscape Dashboard
      • Public Health Dashboard
      • Workforce Diversity Dashboard
      • Supplier Diversity Dashboard
    • Industry Solution:

      Transform Health Equity Initiatives with Equity Quotient

  • Case Studies
    • Industry Case Studies

      Learn how Equity Quotient’s product can provide concrete, actionable insights to drive growth in your industry and purpose for your company.
      Explore All Industries
    • by Industry

      • Banking
      • Real Estate
      • Retail and CPG
      • Manufacturing
      • Healthcare
      • Public Sector
      • Business Services
      • Economic Development
      • Banking
      • Real Estate
      • Retail and CPG
      • Manufacturing
      • Healthcare
      • Public Sector
      • Business Services
      • Economic Development
    • Industry Spotlight:

      Read how EQ can help in the Real Estate industry.

  • Resource Center
    • Resource Center

      Learn about the latest in industry news and data-driven insights while being the first to learn about new product features.

      Visit the Resource Center
    • Resource Categories:

      • Articles
      • Insights
      • News & Updates
      • Articles
      • Insights
      • News & Updates
    • Featured Article:

      The Health Equity Imperative

  • About
    • About Us
    • Contact Us
  • Pricing
  • Ask Rosa
Login
Contact
Equity Quotient logo
Contact
  • Equity Quotient
  • Resource Center
  • EQ IQ
  • Equity Quotient
  • Resource Center
  • EQ IQ

Introducing

Equity Quotient logo mark

The EQ Opportunity Dashboard for the Housing Market & Mortgage Credit

Understand where to look if you’re a homebuyer or invest if you’re a real estate developer or mortgage banker based on detailed supply and demand dynamics across the country.

Introduction

Unpacking Home Ownership

The most significant source of wealth generation for the majority of Americans is home ownership. According to a 2019 Survey of Consumer Finances, “The median homeowner has 40 times the household wealth of a renter–$254,900 for the former compared to $6,270 for the latter…Between 2016 and 2019, housing wealth was the single biggest contributor to the increase in net worth across all income groups, accounting for 32 percent of the overall increase…this is especially true for lower income households.”.1
Race has long played a role in housing policy in the United States as Black Americans are denied mortgages at disproportionate rates. The impact of redlining, a racist Depression-era housing policy, continues to drive down home values in Black neighborhoods and deprive resources for communities of color”.2 There is a long history of disenfranchisement, exclusion and predatory policies against families of color who want to own a home, and unfortunately these barriers persist today. In 2022, “the homeownership rate for white households was 75% compared to 45% for Black households, 48% for Hispanic households, and 57% for non-Hispanic households of any other race”.3 Black homeownership has declined more dramatically than any other racial or ethnic group in the U.S.

In 2019, the Black homeownership rate was about as low as in the 1960s, when private race-based discrimination was legal.4

At a macroeconomic level, the U.S. housing market is an important foundation of our collective viability and growth as a nation as it comprises over 16% of our GDP. as a country.5 If you are part of the economic ecosystem that transacts over 6 million units annually for over $2 trillion, these are challenging yet exciting times as we navigate uncertain waters emerging out of the Pandemic that are impacted by a myriad of unprecedented factors.6 With all of the noise circulating about the national and global economy and confusing signals surrounding where this is all heading, how do you avoid getting overwhelmed and becoming paralyzed to inaction?
The good news is that we now have access to rich data and analytics that is more accessible than ever before. Combining disparate sources into a single picture can help paint a clear path for growth and set the stage for a 3-part journey to growth that includes:

Step 1: Explore Your World

Step 2: Chart a Strategy

Step 3: Execute for Success

Let’s get started with understanding how you can make that happen as a leader in your organization to guide the broader team proactively in achieving new levels of success.
  • back to top

Step 01

Explore Your World

Gain a fresh understanding the challenge and opportunity

One of the most exciting opportunities for growth for the real estate development and financial services sectors is in markets yet to be tapped, or approximately 33% of the population that continues to rent as well as multi-generational families living together but gaining economic independence and the resources needed to own their own home.

In the BIPOC community, the home ownership opportunity is significantly higher as only 48% of the population is participating in home ownership at the national level.7

Regional data on home ownership combined with other relevant factors, such as income, education, business and home ownership, can provide housing developers and mortgage bankers unprecedented insights. Now is the time to take stock of the world around us and chart a new path to growth, both for our organizations and the communities we serve. Economic changes precipitated by the Pandemic and the dramatic rise of inflation and interest rates undoubtedly pose challenges for all businesses and consumers alike, but with adversity comes opportunity for those willing to be thoughtful and see what others might not take the time to consider.
  • back to top

Step 01

Chart a Strategy

Capitalize on the power of growth insights through data and analytics

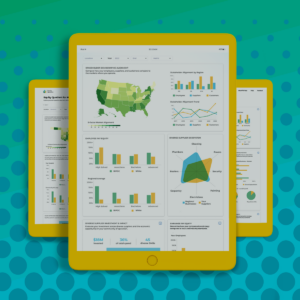
Companies looking to uncover opportunities for growth can start with rich data and analytics that tell a story about each market where they’re currently operating or new frontiers that they’re interested in exploring. Historically, this rich data on consumers, housing, and mortgage financing has been stored in disparate systems and required advanced skills to engineer a cohesive picture of the opportunity by region versus your organization’s current state business. New AI-based technologies and advanced data platforms make it possible and cost effective for any company, large or small, to explore the world where they operate, understand their current state compared to what’s available, and discover untapped go-to-market plays they can map into their strategic plan to achieve both top and bottom-line financial objectives.

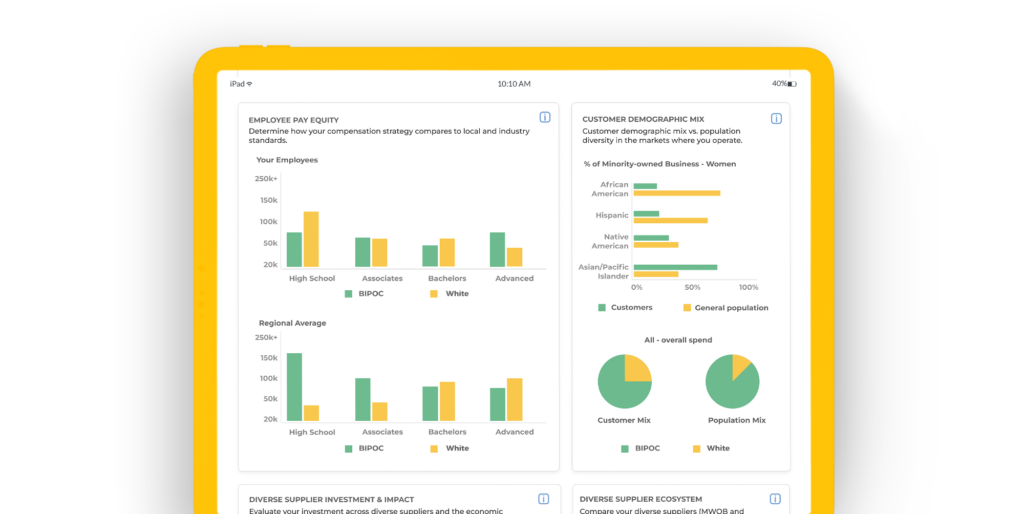
On the demand side of the equation, US Census data intersected with rich private data sources on consumers and businesses can provide a valuable starting point for understanding where the most significant opportunity areas exist. Looking at population metrics by race along with metrics such as average income, business ownership, educational attainment, and home ownership levels surfaces insights into where a critical mass of eligible borrowers exist. 

This data-driven view of markets throughout the US can help real estate development and consumer banking leadership teams determine where opportunities exist for growth within their existing markets or in potential expansion regions.

Meanwhile, real estate and consumer banking leadership teams can overlay the housing supply landscape onto the demand picture to start honing in on where to focus investment and growth initiatives. Looking across the country, you might see that many communities have strong demand metrics but lack inventory of attainable housing. Additionally, understanding how median incomes compare to median home prices within a given subregion can provide insight into the level of affordability, guiding mortgage lenders to where that factor is relatively low or perhaps real estate developers to where it’s relatively high and an opportunity exists to achieve attainable housing developments for first time home buyers. Furthermore, comparing affordability to availability, or the number of housing units in market per available home buyer in a given region, can highlight the most significant opportunity areas for leadership teams looking to chart a strategy to growth and take action with investments and execution initiatives.
  • back to top

Step 01

Execute for Success

Align your organization to take concrete action and seize the opportunity

Now that the strategic initiatives have been defined, it’s time to understand specific actions that can drive change needed to capitalize on untapped growth opportunities.
Gaining insights into how consumers experience the credit funnel process within a given region can help us understand key levers that can be adjusted to unlock growth. Rich demographic and financial data on all mortgage applications and housing transactions by region provides us an exciting opportunity to see our markets in fresh ways and understand how we compare. From the overall pipeline of applications to approval rates to interest rate pricing to appraisal vs. transaction values, we have an opportunity to evaluate where our business processes could be honed to yield a better financial outcome for our companies, customers, and communities more broadly.
For example, we might see that for a given level of income, education, and property value that one demographic group is experiencing higher rejection rates or anomalously low appraisals compared to other groups despite their comparable income and risk profiles. These metrics help us understand where in the process disparities might exist as applicants traverse from loan origination, approvals, interest rates, and appraisal values. Through these insights, we have an opportunity to evolve execution to widen the aperture of how the process works for all potential homeowners and borrowers in our focus markets and unlock unrealized growth.

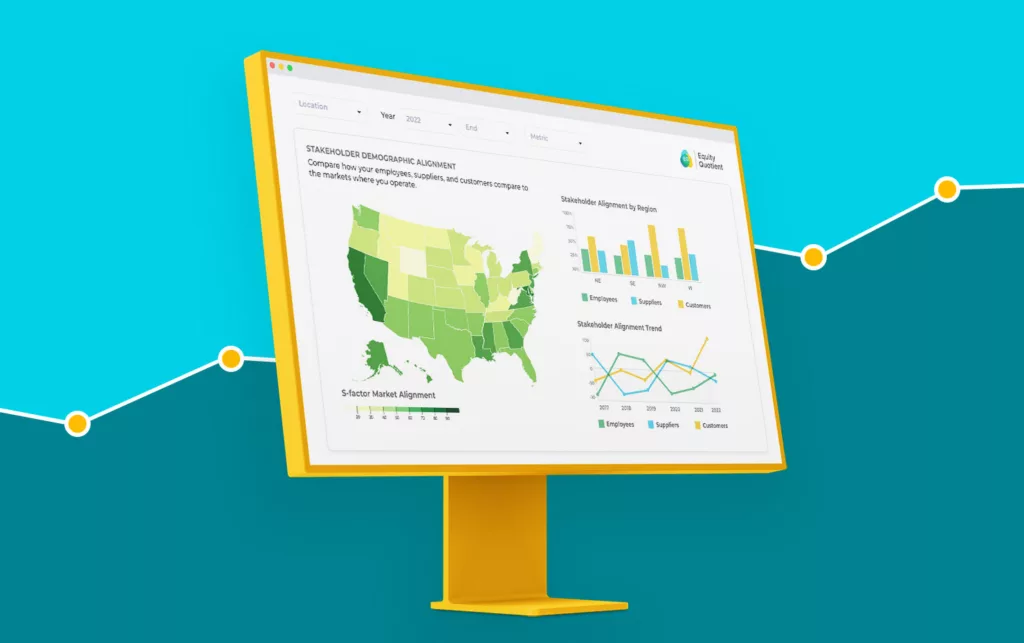
One compelling dynamic that organizations should consider as they devise initiatives to drive growth is the power of Demographic Alignment.

For example, studies have found that when loan officers reflect the communities where they operate, loan originations increase by 20% while default rates decline by 1.7%, eliminating the gap that has historically existed between Black and White borrowers. The power of Demographic Alignment is seen beyond consumer banking in many other verticals, such as healthcare where we see mortality rates decline as much as 20% for adults and 50% for infants, or education where graduation rates increase as much as 30% and college bound students by 15%.

By considering the difference in home ownership levels and other key metrics across the mortgage funnel, we can start to understand the source of the challenge and opportunity that exists for stakeholders on both the supply and demand side of the equation.

  • back to top

Meet Equity Quotient

We increase access to socioeconomic data to shape a thriving economy inclusive of the people that drive it.

Equity Quotient logo mark

Humanizing Data. Catalyzing Growth.

Equity Quotient is an AI-powered stakeholder intelligence platform that aggregates a wide range of socioeconomic data into easy-to-use dashboards to help leaders can make more informed decisions to meet both regulatory and market-driven pressure.

We are charting the future of inclusive AI with our creation of a proprietary data platform, ML-powered analytic model, and use of other advanced AI technologies to create a large language model and make outputs more consumable with natural language processing and interactive visualizations.

With Equity Quotient, executives across sectors better understand their workforce, suppliers, customers, and community to measure impact, automate compliance, and optimize growth.

  • back to top

Endnotes:

  1. Homeownership Remains Strongly Linked to Wealth-Building,” Odeta Kushi, November 5, 2020, First American Blog
  2. New York Times
  3. U.S. Department of Treasury
  4. NPR
  5. Eye on Housing, Robert Dietz, NAHB, January 27, 2022
  6. Total home sales in the U.S. 2011-2021 with forecast for 2023, statista, Statista Research Departner, July 27, 2022
  7. Source: US Census, EQ Dashboard Analytics

An AI-powered stakeholder intelligence platform, Equity Quotient provides leaders with actionable insights to automate compliance reporting, proactively manage risk, and achieve sustainable growth.

Proud Winner

Copyright © 2025 – Equity Quotient |  Terms of Service  |  Privacy Policy

Check out these related articles

The State of Home Ownership in the US

  • August 25, 2023

The Power of Questions: Building an Action Plan for Growth in Housing and Mortgage

  • March 21, 2023

EQ Opportunity Index Dashboards: Gain actionable diversity insights and discover new opportunities for growth

  • March 18, 2023