The State of Home Ownership in the US
Long lost dream or the key to future economic growth for everyone?
The State of Home Ownership in the US
Long lost dream or the key to future economic growth for everyone?
Introduction
The most significant source of wealth generation for the majority of Americans is home ownership. According to a 2019 Survey of Consumer Finances, “The median homeowner has 40 times the household wealth of a renter–$254,900 for the former compared to $6,270 for the latter…Between 2016 and 2019, housing wealth was the single biggest contributor to the increase in net worth across all income groups, accounting for 32 percent of the overall increase…this is especially true for lower income households.”
Yet there is a long history of disenfranchisement, exclusion and predatory policies against families of color who want to own a home, and unfortunately these barriers persist today. In 2022, “the homeownership rate for white households was 75% compared to 45% for Black households, 48% for Hispanic households, and 57% for non-Hispanic households of any other race.” As demonstrated by these statistics, Black communities have been the most impacted. Black Americans are also denied mortgages at disproportionate rates. Not only that, according to NPR Black homeownership has continued to decline more dramatically than any other racial or ethnic group in the U.S.: “In 2019, the Black homeownership rate was about as low as in the 1960s, when private race-based discrimination was legal.”
While this seems like an insurmountable disparity, the advances of AI have given us an opportunity to start closing these gaps. By using AI-guided data collection and Machine Learning, we can pull information from various sources across different socioeconomic sectors to build a dynamic picture of a community. From that picture, we can derive insights to both help build home ownership for historically disenfranchised populations, as well as unlock growth opportunities for companies operating in the housing market of that region.
A Case Study: The Massachusetts Housing Market
To better understand the current state of housing economics in the United States, let’s start with a look at the data, specifically in Massachusetts. We used a combination of data from the U.S. Census, the Housing Mortgage Disclosure Act, and Zillow in order to gain socioeconomic insights. Exploring housing demand and supply metrics across the United States as well as access to mortgage credit tells a stark but interesting story.
Despite its strong, diverse economy and population, Massachusetts struggles with inequality between the black and white population across multiple socioeconomic factors. For black citizens, the quality of life looks very different than that of white citizens. Unemployment is nearly double, while the income gap between the two populations is 35%. That challenge makes home ownership significantly more elusive, with approximately one-third of black citizens owning homes compared to over two-thirds of the white population.

The often applied rule of thumb for home affordability is that a borrower should plan to spend approximately one-third of their income on housing, or target a home that is roughly three times their income. With a median home value of nearly $700K, the 3x income rule suggests that the average home buyer would need to be making over $230K/year, yet the median income for black households in Massachusetts is $59K.
Next, let’s take a look at the credit funnel or access to mortgages in Massachusetts to gain a fuller picture of housing economics. By income group, we are able to compare black and white borrowers that apply for mortgages across the state and understand how the “same” borrower might experience the banking process. More specifically, we can explore whether bias exists and determine if an opportunity exists to evolve people, process, and/or technology to overcome it.
In Massachusetts, we see that across every income category, the approval rate for black borrowers is materially lower than whites (e.g., 63% for black applicants vs. 79% for white applicants with incomes of $150K-$200K) while the average interest rate applied to the same income category is several basis points higher (3.1 for white borrowers vs. 3.25% for black borrowers).

In addition to the higher cost of capital, we also see that the amount of the mortgage as a percentage of the home value is also higher. The implication of these two factors is that the black borrower’s mortgage payments are requiring a significant percentage of income across the life of the loan while they are building less equity in their home as a result of a higher leverage ratio.

Moreover, these two factors are conspiring to put the black borrower, even at the highest income levels, from achieving the same opportunity for wealth building opportunity. At lower income levels, it’s crippling populations and putting them in a vicious cycle of poverty that is a significantly higher hurdle to overcome than the white community.
Where do we go from here?
Looking at the housing market economics across all racial and ethnic groups in a region such as Massachusetts provides actionable insights into the challenge and opportunity that exists in the region–for borrowers, housing developers, and mortgage bankers.

At a macroeconomic level, the U.S. housing market is an important foundation of our collective viability and growth as a nation as it comprises over 16% of our GDP as a country. If you are part of the economic ecosystem that transacts over 6 million units annually for over $2 trillion, these are challenging yet exciting times as we navigate uncertain waters emerging out of the Pandemic that are impacted by a myriad of unprecedented factors.
What is certain is, as demonstrated by just looking at the Massachusetts case study, there are compelling untapped markets in the BIPOC community if bias is taken out of the equation. U.S. BIPOC spending could be the 5th largest economy in the world, exceeding that of Great Britain. Emerging out of the Pandemic, now is the time for all of us to take a fresh look at the world around us across all stakeholders–customers or borrowers, suppliers in the housing market, and the employees such as loan officers that engage with these markets. Proactive intentionality around understanding and devising strategies to capitalize on these segments can yield material positive results for businesses and outcomes for individuals and communities.
One compelling dynamic that organizations should consider as they devise initiatives to drive growth is the power of Demographic Alignment. For example, studies have found that when loan officers reflect the communities where they operate, loan originations increase by 20% while default rates decline by 1.7%, eliminating the gap that has historically existed between Black and White borrowers. (insert source citation) The power of Demographic Alignment is seen beyond consumer banking in many other verticals, such as healthcare where we see mortality rates decline as much as 20% for adults and 50% for infants, or education where graduation rates increase as much as 30% and college bound students by 15%. (insert source citation)
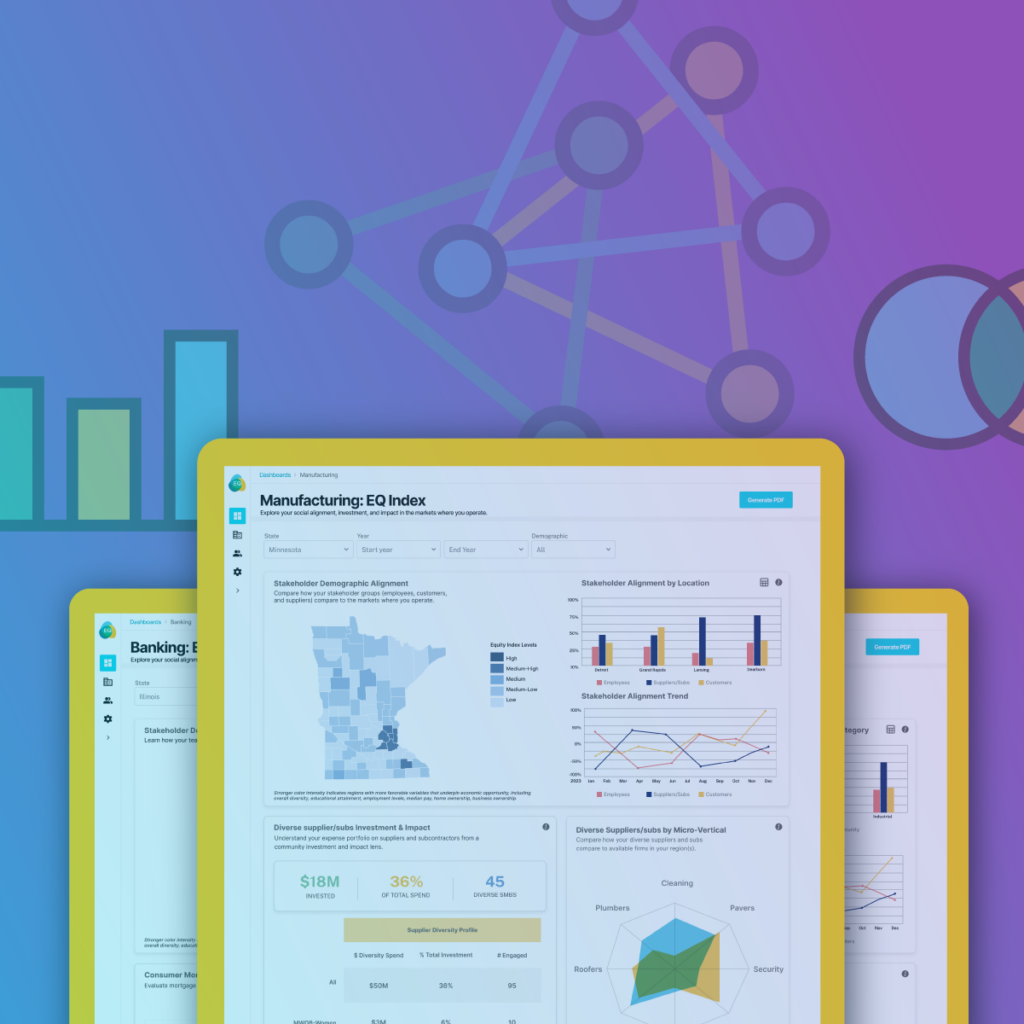
The good news is that we now have access to rich data and analytics that is more accessible than ever before in order to capitalize on these opportunities.
To read more about how to navigate these insights and gain strategies, check out our 3-part journey to growth.
To read more about how to navigate these insights and gain strategies, check out our 3-part journey to growth
Get In touch
Now that you’ve seen the power of harnessing the right data,
in order to drive growth and help build a thriving economy, contact our team at EQ and learn more!
GET IN TOUCH


