Understand your markets and stakeholders more deeply to hone demographic alignment, unlock new growth, stay compliant, and reduce risk.
Explore our Case Studies:
Business Services
Understand your markets and stakeholders more deeply to hone demographic alignment, unlock new growth, stay compliant, and reduce risk.
Explore our Case Studies:
ESG Scoring Model (1 of 600+)
Scenario
Leading ESG model lacks a quantitative standard for evaluating the S factor similar to emissions measurement for E
Client Challenge
A leading ESG scoring model is under fire for the lack of quantitative measurement that underpin its framework. While emissions measurement platforms have helped add objective rigor and efficacy to the E that can be benchmarked across peers and tracked over time, the S is based on high level subjective inputs that preclude the same level of risk analysis (i.e., board/exec team diversity, social media reputational scraping, employee survey).
EQ Solution
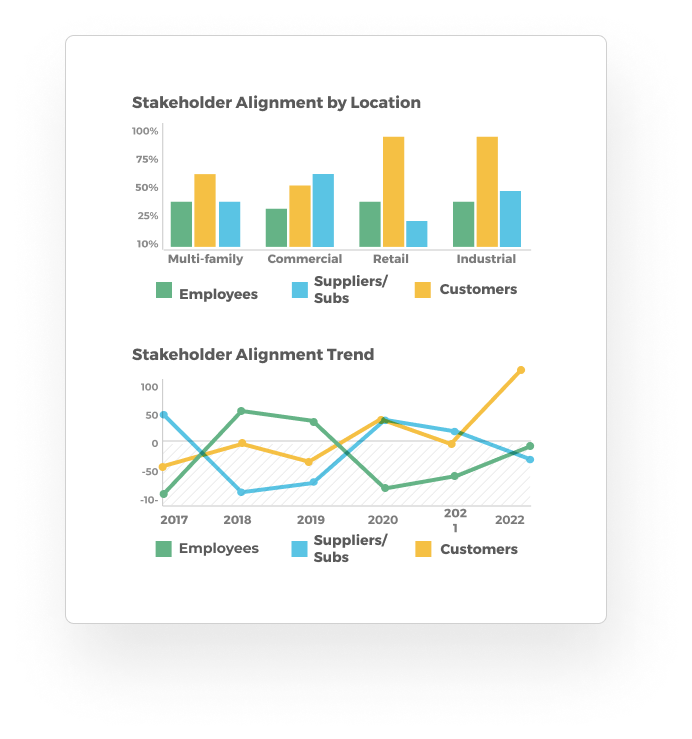
Anchored in the proven concept of Demographic Alignment, Equity Quotient’s rich data and AI-powered analytics platform makes it possible to quantitatively measure S risk across all relevant stakeholders– employees, suppliers, customers, and communities. Driving quantitative rigor can help scoring models maintain relevance and annual revenues of ~$2B growing at >30% YoY.
A dashboard that optimizes decision making
Track to a standard
Bolster efficacy of scoring model by achieving a quantitative approach to measuring ESG S comparable to ESG’s E emissions measurement platforms.
Manage S in ESG data
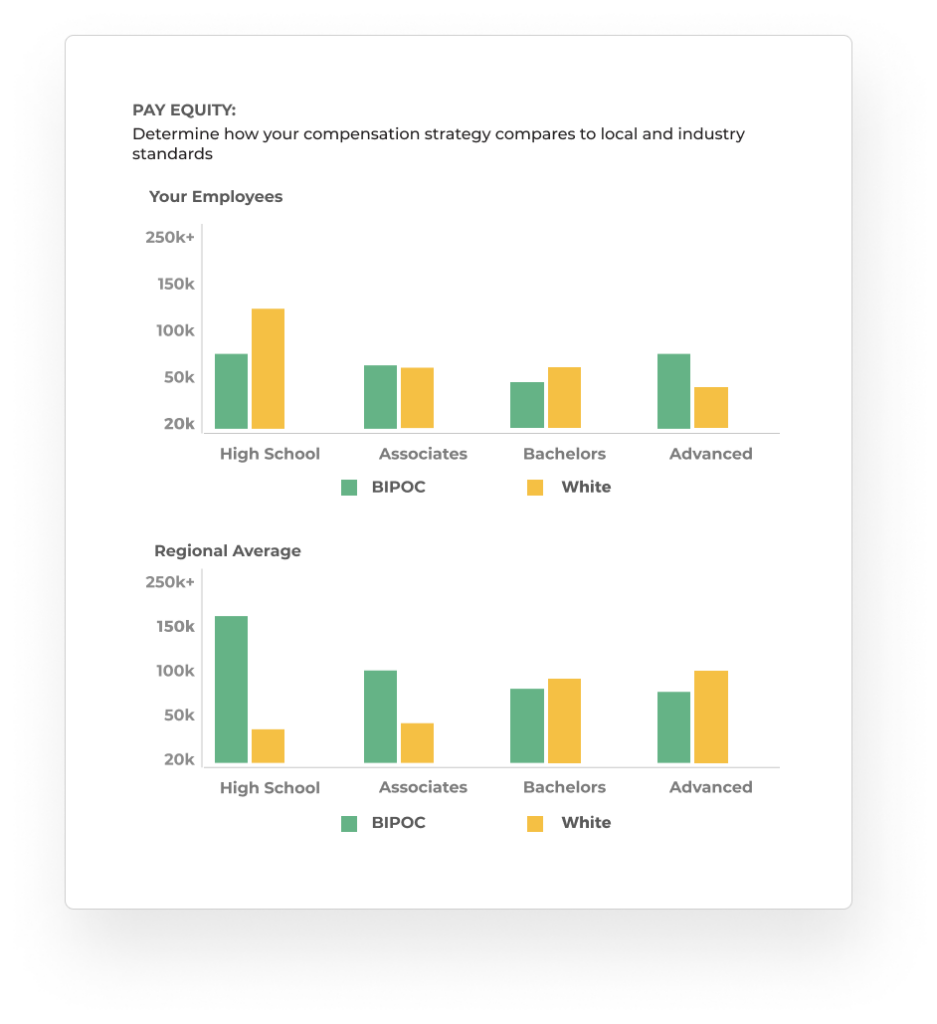
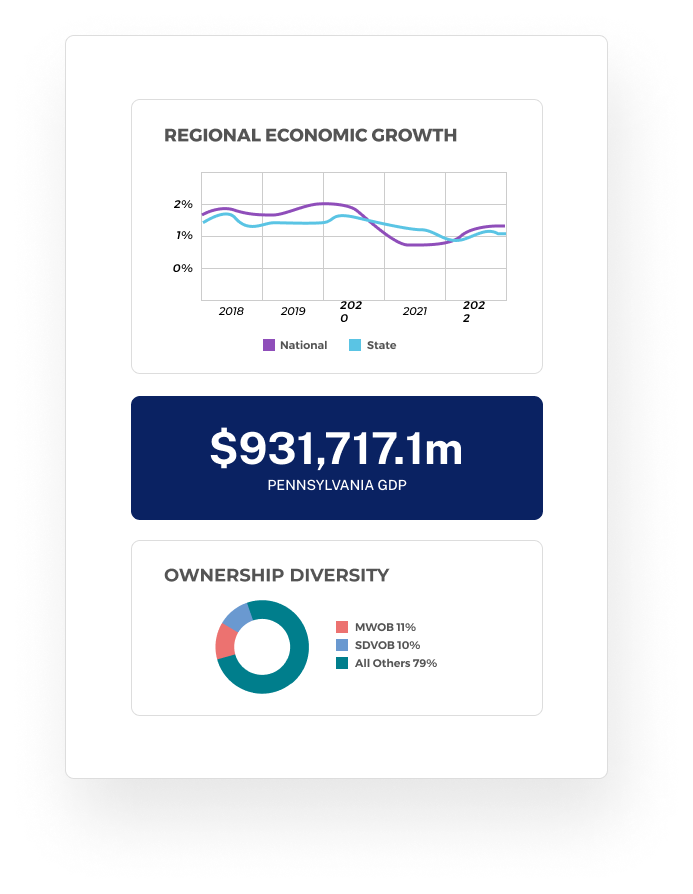
Automatically generate rich data on S KPIs such as pay equity and median income by geo/ industry/ role along with inputs on reputational analytics and stakeholder survey feedback.
Benchmark & track
Compare companies to more relevant benchmarks based on geo/ industry/ size/ business model and other relevant factors over time to more accurately understand risk.
Turn insights into action and impact!
Automate S in ESG data
to achieve stronger efficacy and efficiency in models.
Hone peer groups
to be more relevant based on geo/ industry and other relevant factors.
Differentiate score
based on robust, actionable measurement that’s relevant to investors and firms.