EQ Opportunity Index Dashboards
EQ Opportunity Index Dashboards
Gain actionable diversity insights and discover new opportunities for growth
Key Highlights:
- The EQ Opportunity Index helps you quickly understanding the level of access and affordability in each community across the United States and exploring the opportunity in each market.
- Apply a data-driven approach to understand the current state and chart a future state to growth. Cut through the noise in a complex global competitive landscape.
Table of Contents:
Get to Know The Dashboards
Meet Equity Quotient
Section One
Get to know the dashboards
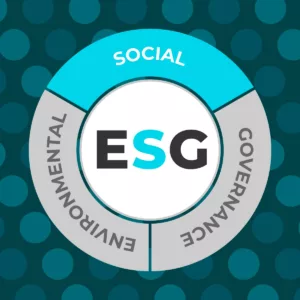
Learn about what they are, how they work, and why they will help you measure and manage the S in ESG.
Get to Know The Dashboards
What is an EQ Opportunity Index dashboard?
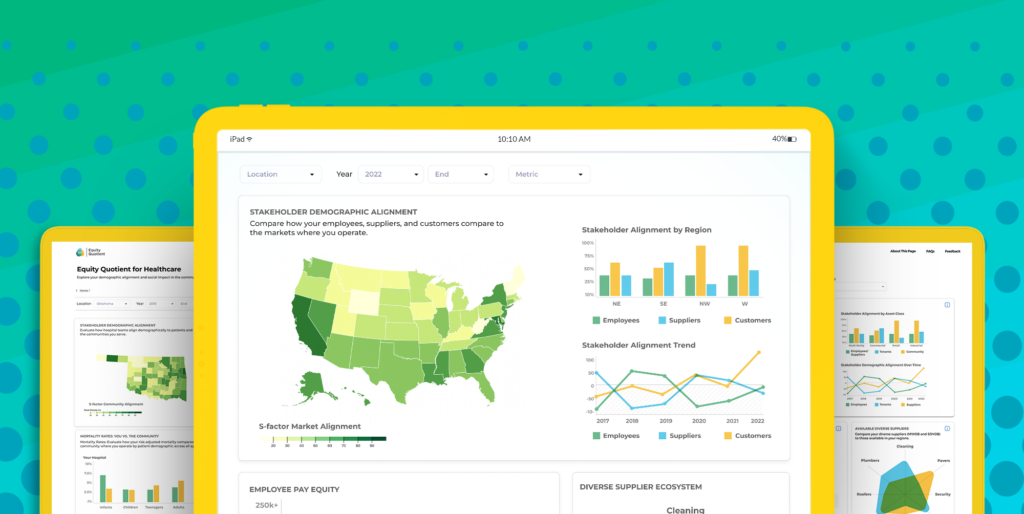
Equity Quotient is committed to helping companies measure and manage their ESG S-factor or DEI imperatives by understanding their stakeholders in the context of the markets where they operate. Through rich data and advanced analytics that are easy to use, company leaders are able to dynamically glean actionable insights about their employees, suppliers and customers compared to their surrounding communities.
Detailed diversity data enables Equity Quotient to calculate the Demographic Alignment between an organization’s stakeholders and its markets, a concept proven to drive superior financial performance and compelling social impact across banking, retail, healthcare, education and other industries. Meanwhile, expanded socioeconomic data profiling educational attainment, pay equity, home ownership, business ownership, health insurance coverage and other relevant factors in the region can offer a more comprehensive picture of a company’s relationship to its world and help leaders uncover fresh, objective perspectives on where their stakeholder strategies could improve.
Beyond managing risk related to ESG, DEI and other compliance mandates, every company can capitalize on this same data and analytics to discover new opportunities that can drive unprecedented growth. Emerging from the challenges and changes of the COVID-19 pandemic, the world and its opportunities look different. Rich demographic and economic data for each region provides insight into your current markets and the best way to maximize growth from your existing investments operations. This same data can also help leaders explore new regions, highlighting where the best mix of conditions exist for expansion and powering strategic growth models.
Every region is diverse and every company is unique based on its surrounding population, industry vertical, size, level of maturity, business model and other factors. Equity Quotient’s platform is focused on providing a rich data and analytics platform that recognizes each company’s uniqueness and highlights actionable insights based on those nuances. This objective, data-driven approach combines the flexibility needed to meet companies where they are and uncovers a relevant path to becoming more successful and impactful.
Within that broader platform, the EQ Opportunity Index is an approach for quickly understanding the level of access and affordability in each community across the United States and exploring the opportunity in each market. The EQ Opportunity Index heatmap at the top of each dashboard is powered by advanced analytics based on a calculation that summarizes all of the detailed data existing in each region — diversity, educational attainment, unemployment, pay equity, home ownership, business ownership and other relevant factors — and provides a high-level view of the level of access and affordability for each community compared to others. Underneath the heatmap summarizing the EQ Opportunity Index, each Equity Quotient dashboard features expanded insights, enabling users to explore how different states and communities compare to each other, and how those metrics might look different across the racial and ethnic groups that reside within each region.
The EQ Opportunity Index has been derived across multiple factors — General Population, Education Access, Employment Landscape, Housing Market, Mortgage Credit, Business Diversity and Community Health — to provide a comprehensive view of the overall health-wealth profile for each region across the United States. These dashboards are the foundation for helping company leaders and other interested stakeholders begin to explore the world around them and ask questions about their own organization’s current state and path to future growth. They also provide the backbone for Equity Quotient’s Industry Dashboards, which will provide companies with automated, dynamic insights into their own stakeholder data from employee, supplier and customer systems, merged with Equity Quotient’s core data platform to achieve purpose-built insights based on relevant industry compliance imperatives and competitive dynamics.
Get to Know The Dashboards
How does Equity Quotient’s technology work?
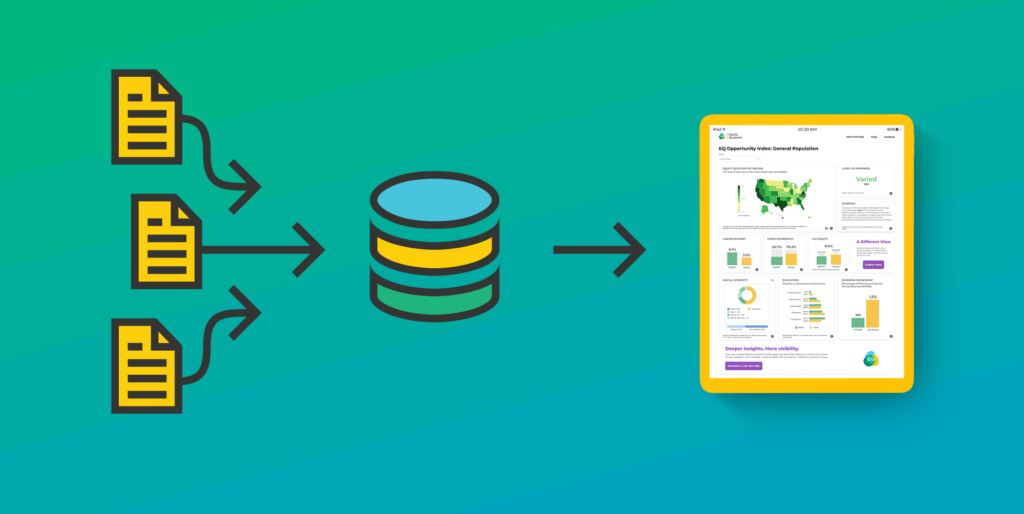
Let’s explore the key ingredients that underpin EQ Opportunity Index dashboards:
1. Rich data platforms
Thanks to Data.gov, socioeconomic and demographic data on communities across the United States — including detailed information about citizens and businesses that operate within them — is available for analysis. Private companies such as payroll providers, credit bureaus and real estate platforms have also made valuable data on consumers, borrowers, housing, businesses and other relevant factors available to the public.
Other sources such as social media monitoring can complement this core data with qualitative perspectives by region on how stakeholders are talking about industries, companies or other relevant topics. Those external data sources can be merged with internal company data from enterprise systems (e.g., HR, procurement, CRM, stakeholder surveys) to achieve robust analytics, benchmarking and trending to support advanced decision-making and automate reporting.
2. Innovative analytics
New technologies have made it possible to manage big data analytics at scale, effectively mining the raw material to provide consumable, actionable insights. Applying domain expertise related to the S in ESG to determine how to best capitalize on the rich data and advanced analytics enables a company to understand and manage its social impact posture in the context of the communities where it operates.
Demographic Alignment, or the measurement of a company’s stakeholders compared to the surrounding communities where they operate, can provide valuable insights to proactively identify risks or unlock opportunities for growth. Studies across multiple industries, from consumer banking and retail to healthcare and education, have indicated that stakeholder Demographic Alignment is the key to achieving positive social impact and driving strong financial performance.
Applying AI-powered analytics to derive the correlation or deviation between an organization’s employees, suppliers and customers compared to the communities where it operates can provide a dynamic view of both cause and effect over time. New technologies also make it possible to automatically serve up compelling insights and recommendations based on platform best practices.
3. Consumable UX and actionable insights
Data and analytics lack value unless they are rendered in a format that is simple and easy to understand. Data visualizations are presented through easy-to-use dashboards and summarize key points in a quick, compelling way. This approach makes it possible for boards, executives and their teams to quickly understand their current state and align around go-forward strategies that can drive competitive advantage.
These visualizations can also highlight insightful relationships between underlying factors that might not otherwise be known, inspiring new ways of seeing organizational stakeholders and innovative initiatives that can unlock growth. Users wishing to go beyond the headlines are able to easily explore the details behind the insights to quickly understand root cause or pursue a tangential path to more deeply understand current state and future actions they might take. Users also have the ability to automate outputs needed for various stakeholders, such as regulatory entities, investors, employees, customers or the community at large.
Get to Know The Dashboards
Why use EQ Opportunity Index dashboards?
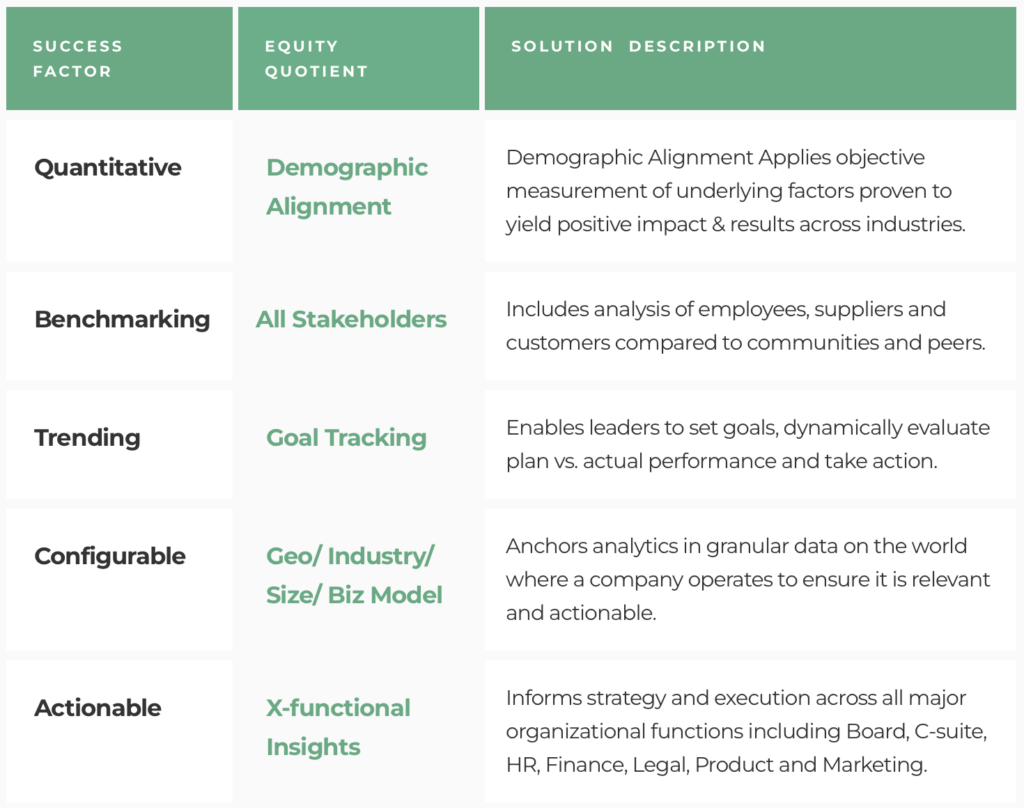
These three ingredients — rich data, advanced analytics and insightful dashboards — enable companies to achieve the five key success factors needed for an effective ESG S-factor measurement platform.
- Success Factor
Equity Quotient
Solution Description
- Quantitative
Demographic Alignment
- Demographic Alignment Applies objective measurement of underlying factors proven to yield positive impact & results across industries.
- Benchmarking
All Stakeholders
- Includes analysis of employees, suppliers and customers compared to communities and peers.
- Trending
Goal Tracking
- Enables leaders to set goals, dynamically evaluate plan vs. actual performance and take action.
- Configurable
Geo/ Industry/ Size/ Biz Model
- Anchors analytics in granular data on the world where a company operates to ensure it is relevant and actionable.
- Actionable
X-functional Insights
- Informs strategy and execution across all major organizational functions including Board, C-suite, HR, Finance, Legal, Product and Marketing.
To date, the S in ESG has lacked a standardized approach, leading to widespread confusion and frustration among investors, companies and other stakeholders about how to measure and manage it. EQ Opportunity Index dashboards provide an innovative, objective solution to overcoming that challenge by offering an approach that’s standardized, relevant, achievable and impactful.
Beyond the compliance imperative, studies across multiple industries have demonstrated that companies have much to gain by proactively embracing the S in ESG. Stakeholder-aligned and led companies outperform peers on every major internal (e.g., revenue growth and profitability) and external (e.g., stock price and cost of capital) metric. As we continue to face the challenges of a post-pandemic global economy, it’s more important than ever to focus on these foundational ESG S stakeholder pillars: employees, suppliers, customers and community. Applying a data-driven approach to understand the current state and chart a future state to growth can help cut through the noise in a complex global competitive landscape. An exciting opportunity exists to capitalize on advanced technologies and gain unprecedented insights that can guide your organization toward achieving the best possible version of itself throughout the entire value chain.
Ready to get started? Check out our Questions Guide and take it to your next executive meeting or strategic planning session to kick off the conversation.
Meet Equity Quotient
We increase access to socioeconomic data to shape a thriving economy inclusive of the people that drive it.
Humanizing Data. Catalyzing Growth.
Equity Quotient is an AI-powered stakeholder intelligence platform that aggregates a wide range of socioeconomic data into easy-to-use dashboards to help leaders can make more informed decisions to meet both regulatory and market-driven pressure.
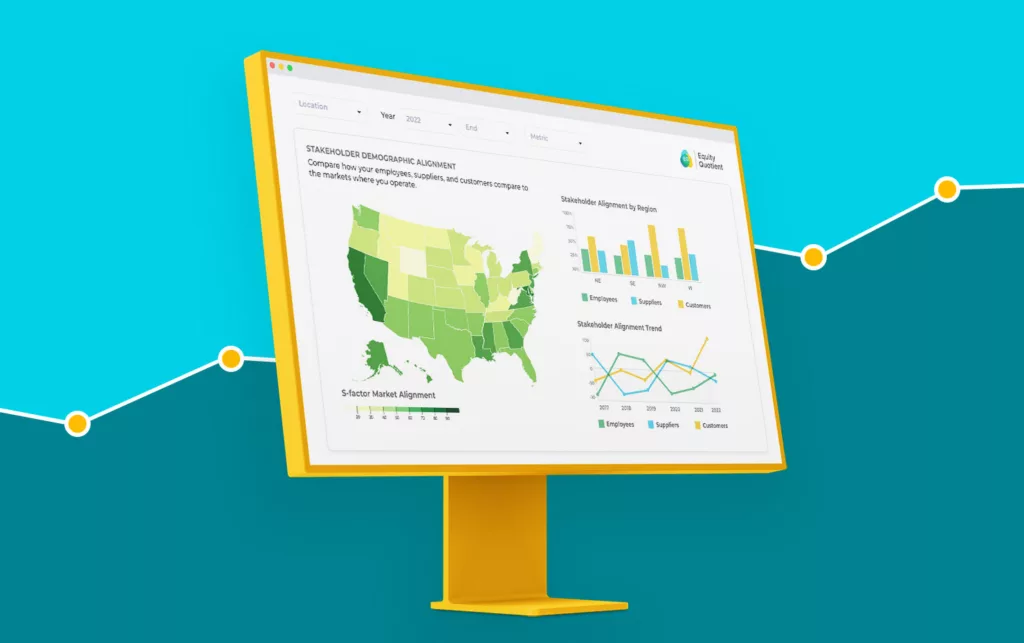
We are charting the future of inclusive AI with our creation of a proprietary data platform, ML-powered analytic model, and use of other advanced AI technologies to create a large language model and make outputs more consumable with natural language processing and interactive visualizations.
With Equity Quotient, executives across sectors better understand their workforce, suppliers, customers, and community to measure impact, automate compliance, and optimize growth.


