Key Highlights:
- New guidelines coming out of the EU are likely to have an impact on most US-based companies.
- We review Cooley’s 2022 document providing guidance on the new EU guideline changes in detail.
- Review key sections of the Social S factor setting of the Cooley report, as the compare between the CSRD and the SEC
Table of Contents:
Introduction
ESG S-factor Social Impact Guidelines
Meet Equity Quotient
Section One
Introduction
The impact of new guidelines in the EU and what they mean for the US


Introduction
The EU expands the range of non-financial reporting obligations
This fall, the European Union (EU) issued new guidelines for mandatory ESG reporting that will indirectly impact many US-based companies—particularly those with a role in the broader value chain ecosystem of an entity that is required to report. According to a recent piece published by Cooley , the new Corporate Sustainability Reporting Directive (CSRD) significantly expands the range of non-financial reporting obligations for companies based in the EU. Those requirements are to be included in a separate section of the management report and will be made publicly available through the EU website. CRSD will apply to both public and private non-EU companies that meet the thresholds defined in the guidelines.
While the US Securities & Exchange Commission (SEC) has not been as specific or expansive in its reporting and disclosure requirements, it recently proposed climate change and cybersecurity reporting rules and is expected to propose human capital and board diversity disclosure rules over the next year. US company stakeholders care about ESG-related imperatives, and the call for transparency is stronger than ever. The vast majority of public companies now report on ESG-related topics in their 10-Ks and annual reports despite the fact that US law does not technically require disclosure. From the largest investment management firms assessing capital allocations to the individual consumer who’s making choices about which products and services to buy, market forces have made being intentional about positive impact a competitive advantage in the context of driving growth and strong financial outcomes.
These changes coming out of the EU are likely to have an impact on most US-based companies. So what should company leaders do? That’s exactly our goal — to help you easily understand what this means for your organization, particularly as it relates to the S-factor, or how to best measure and manage your social impact as part of a broader ESG imperative. Let’s get started by taking a closer look at the new CSRD standards.
Section Two
ESG S-factor Social Impact Guidelines
Learn about the guidelines as we break them down line by line
ESG S-factor Social Impact Guidelines
CSRD vs. SEC
In its October 2022 piece, Cooley published a document providing guidance on the new EU changes and how they compare to the US SEC’s current state regulatory requirements. We highly recommend checking out their entire overview that covers the E, S and G components of the ESG equation, but our focus here will be on the S-factor and how your organization can get after—and ahead—of it.
Featured here is an excerpt from Cooley’s guidelines focused on the social piece of the ESG equation:

At first glance, these new EU-CSRD standards appear to impose an unfair burden on companies, on top of mounting competitive pressures and other challenges corporations face in the post-pandemic global economy. These opaque requirements can feel frustrating and confusing — but unfortunately, companies really have no choice but to figure it out. Most companies genuinely want to be thoughtful and intentional about their impact on the world around them, and understand that doing good is good for business.
The key to getting this right requires executive teams and boards to elevate themselves above all of the noise, ambiguity and political rhetoric related to ESG to clearly see their unique opportunity for growth. That opportunity lies in capitalizing on rich data and analytics to achieve an automated, objective and actionable approach to evaluating your particular organization and its stakeholders — employees, suppliers and customers — in the context of the specific communities in which you operate. Let’s dive into the specifics about how to achieve that:
- Data: The foundation of any objective measurement framework is rich, relevant data that enables benchmarking to understand yourself in the world in which you operate. By merging public and private data sources to create a detailed socioeconomic profile by sub-region, it becomes possible for companies to understand how they compare to their communities — particularly their talent, suppliers and customers. It is also possible to achieve rich insights through peer benchmarking on metrics such as educational attainment, pay equity, home ownership and other relevant quality of life metrics.
- Diversity and demographic alignment: Several studies across verticals such as consumer banking, retail, healthcare and education have demonstrated the power of achieving diverse leadership in organizations, and being intentional about demographic alignment between a company’s stakeholders. Both strategic imperatives have been shown to drive competitive advantage and superior performance across all major categories globally. What’s most exciting about the concept of demographic alignment is that it can be objectively calculated and measured over time. It is also highly flexible and thoughtful about a company’s unique situation. We define demographic alignment as the standard deviation of a company’s stakeholder groups to each other and to the communities where they operate over time. This calculation recognizes the uniqueness of each company’s situation — geography, industry, size and business model — to go beyond decontextualized, high-level percentages that aren’t relevant or actionable. This combination of being quantitative and concrete while also providing flexibility helps companies make continuous tradeoffs to remain competitive and drive strong financial performance.
- AI-powered analytics: New technologies make it possible to dynamically calculate demographic alignment and other meaningful impact and performance metrics at scale, in a cost-effective way. Fortifying the core public-private data model with peer data creates a powerful publish-and-subscribe model, where each organization benefits from the collective intelligence being gathered and shared. Beyond dynamically calculating an organization’s demographic alignment, companies have the opportunity to achieve expanded metrics that paint a meaningful picture of their S-factor social impact across a number of dimensions.
- Dynamic, operationalized tracking: Historically, most companies have scrambled to pull together point-in-time impact metrics and reports from disparate data sources in offline spreadsheets. This approach is not only costly and inaccurate, it puts the exercise outside of core functions as an “extracurricular activity.” Companies are missing an important opportunity to unlock growth and achieve positive impact outcomes by handling ESG and social impact reporting as a one-off measurement for an annual report or SEC filing. Making ESG reporting core to the DNA of their people, processes and technologies can help drive the pervasive change that is needed.
- Flexible outputs and applications: ESG has become a nebulous, broad description for a wide range of strategy, execution and ongoing reporting that is the responsibility of all parts of the organization in one way or another. Annual reports and SEC 10-K filings are just one example of how companies need to measure and manage their S-factor social impact. HR leaders need to understand their talent — both their current employee roster, and the broader market of what’s available to them. Finance leads need to continuously manage their procurement in a way that maximizes resilience and cost, which requires ongoing evaluation of their current suppliers and the broader value chain ecosystem. Marketing leaders must constantly uncover new growth opportunities while making sure their pricing and engagement models yield fair, positive outcomes across segments. Executive teams need to devise fresh strategies to drive growth on an ongoing basis, which requires an outside-in view of the organization and their stakeholders in the context of the world where they operate. All of these use cases call for a platform that can support companies in a way that evolves ESG S-factor reporting from being an extracurricular, offline activity to one that can accommodate all of these business processes that extend from strategy to execution.
Now, let’s circle back to the EU-CSRD requirements, going line-by-line to detail how you might begin to align your organization with the new mandates.
ESG S-factor Social Impact Guidelines
Employees & talent

Traditional approaches to understanding workforce diversity, equity and inclusion (DEI) have lacked an awareness of a company’s uniqueness, such as its geography, industry, size, age, business model, maturity and financial objectives. This lack of definition around a benchmarking framework and access to rich external data that can support a robust, practical exploration of a company in its “world” has led to confusion for companies about what success looks like for them. How do you know if a company is in good shape from a workforce perspective if it publishes numbers that aren’t tied to anything relevant and actionable? Current ESG scores net out a single number across all factors based on a benchmark to supposedly other “peer” firms, but that approach isn’t actionable for companies or insightful for external stakeholders trying to understand a company’s past, current and prospective S-factor.
Ideally, a company’s workforce situation should be measured within the context of what’s possible based on its unique situation. By first defining the boundary condition, we are better able to achieve a meaningful exploration of an organization in the context of the micro-world(s) where it operates and devise specific, achievable initiatives to drive growth and address potential risk factors.
Start by understanding how all of your stakeholders, including your customers, suppliers and talent, compare to the markets in which you operate. Every community and every company is unique, so gaining an understanding of workforce diversity can provide the most relevant and actionable picture, both for you and external audiences. Understanding how your team(s) compare to your communities and customers includes analysis of demographic alignment, or how closely your teams reflect the world around you, can provide a concrete, consumable approach to measuring and managing your S-factor social impact as it relates to your workforce.
This exploration of alignment can start with a comparison of demographic attributes at various functions throughout the organization. From there, we recommend understanding how compensation, level of education, home ownership and other quality of life factors compare internally across levels and roles by race and gender, while also benchmarking your current state to peer firms by region or subregion.
The process of taking a fresh look at yourself in the context of the world in which you operate can provide boards, executives and their teams concrete, actionable insights into where your organization might benefit from specific initiatives that can drive growth and get ahead of potential risks. Furthermore, this approach to calculating demographic alignment and other related benchmarking on quality of life metrics in the context of your broader community(ies) can help your organization to establish clear “From:→To:” goals and chart a path to achieving them. It also provides a dynamic view into your organization’s progress over time and specific areas where the organization is doing well or might need more focus.
ESG S-factor Social Impact Guidelines
Supply chain ecosystem
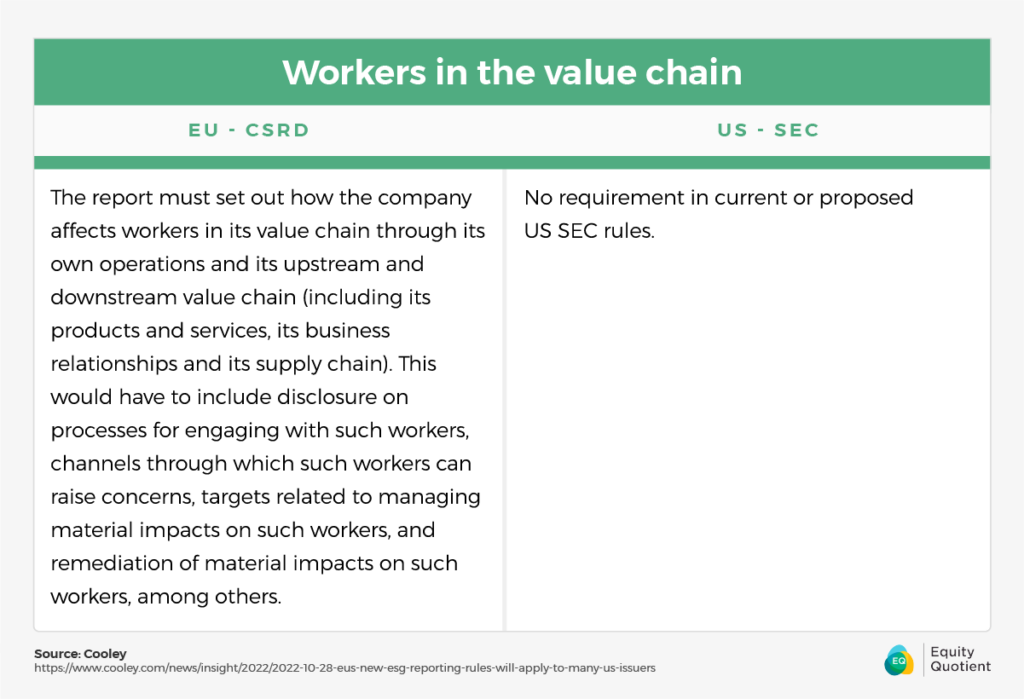
With access to data on the business ecosystem through a demographic lens, you can quickly gain insight into how your current supplier ecosystem compares to what is available to you. That analysis of your value chain’s demographic alignment to your market’s business ecosystem by micro-vertical provides a concrete, consumable and actionable perspective on where your organization might tap new vendors in a way that builds diversity and resilience in your supply chain and unlocks improvements in financial performance metrics.
Beyond an initial analysis of your value chain’s demographic alignment to the markets in which you operate, seeing your procurement spend as an investment portfolio can help you tell a strong, clear story for external stakeholders about your surrounding community and economy. Aside from ESG reporting, many companies find they need to tell this story to gain approvals for various initiatives from state and local government entities or community interest groups.
Exciting opportunity exists to unlock growth through proactively evaluating your value chain in a way that incorporates rich socioeconomic data to achieve a more holistic view of your operations within the context of your local economy. More objective, concrete measurement enables focus, action and change that can help your organization achieve the intersection of strong financial performance and impact. Evaluating your value chain through a socioeconomic impact lens that recognizes your company’s unique geography, industry, size, age or maturity, business model and financial objectives can not only provide clear metrics for ESG-related reporting but align your teams around specific initiatives that can drive growth.
ESG S-factor Social Impact Guidelines
Communities at large
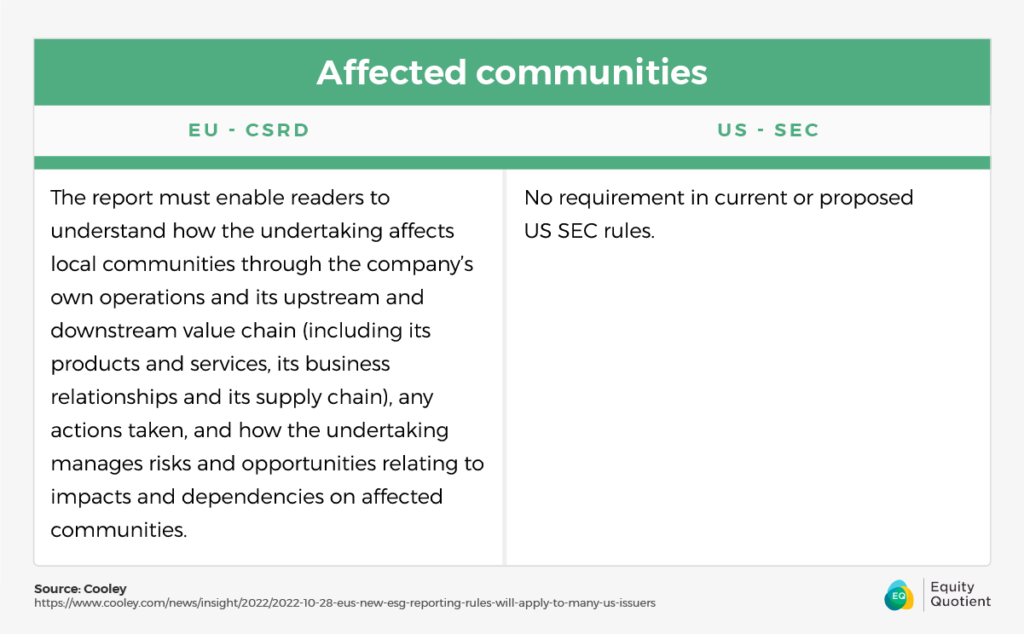
The key to gaining a clear, concrete and measurable approach to ESG’s S-factor is by starting with understanding the unique socioeconomic data of the community(ies) in which a company operates. That process starts by exploring rich data by micro-region and key quality of life metrics such as level of education, unemployment, business ownership, pay equity and home ownership. Advanced analytics enable companies to evaluate themselves dynamically against their affected communities by intersecting data on their three key stakeholder groups — employees, suppliers and customers — with that broader external socioeconomic data on their relevant region(s).
This ongoing analysis of an organization’s demographic alignment with their affected communities provides an exciting opportunity for companies to understand and act on their ESG S-factor in a way that hasn’t been possible historically. Here are the factors that make it possible:
- Measurable: The data-driven approach that applies advanced AI-powered analytics enables a more granular and concrete measurement of a company’s stakeholder relationships.
- Relevant: Rich analytics compare bottom-up data from company systems on their employees, suppliers and customers to detailed socioeconomic data on the people, businesses and other relevant factors in the specific communities in which they operate.
- Actionable: This measurable, relevant approach to understanding an organization’s demographic alignment at a granular level is more concrete and actionable across the organization.
- Dynamic: The only thing that’s constant is change. Having an approach that continuously calculates a company’s stakeholder’s socioeconomic metrics compared to the communities in which it operates achieves both concreteness and flexibility.
- Growth-focused: Many see ESG purely through a compliance lens, but there’s a compelling opportunity to capitalize on S-factor social impact analytics and achieve a stakeholder-driven strategy that can uncover fresh insights and unlock growth.
Moreover, embracing a proactive approach to measuring and managing your S-factor social impact can become a powerful competitive advantage. Companies that are intentional about diversity in their leadership teams and drive stronger demographic alignment throughout their operations significantly outperform their peers.
ESG S-factor Social Impact Guidelines
Customers
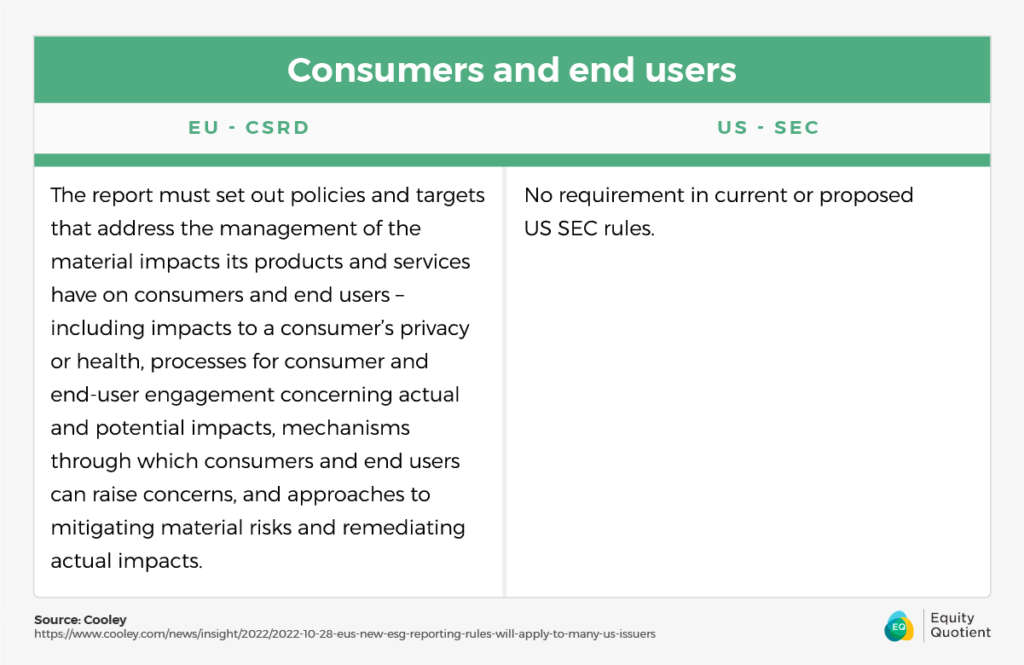
Along with evaluating talent and suppliers through a demographic lens in the communities where you operate, there’s an opportunity to achieve similar analytics of your customer base. This understanding can provide important insights into untapped opportunities for growth, while also highlighting specific policies around marketing, pricing and packaging or ongoing engagement. Furthermore, these insights can guide your teams to develop new strategies for addressing underserved communities and honing all aspects of people, processes, and technologies that impact the entire customer lifecycle funnel.
Meet Equity Quotient
We increase access to socioeconomic data to shape a thriving economy inclusive of the people that drive it.

Humanizing Data. Catalyzing Growth.
Equity Quotient is an AI-powered stakeholder intelligence platform that aggregates a wide range of socioeconomic data into easy-to-use dashboards to help leaders can make more informed decisions to meet both regulatory and market-driven pressure.
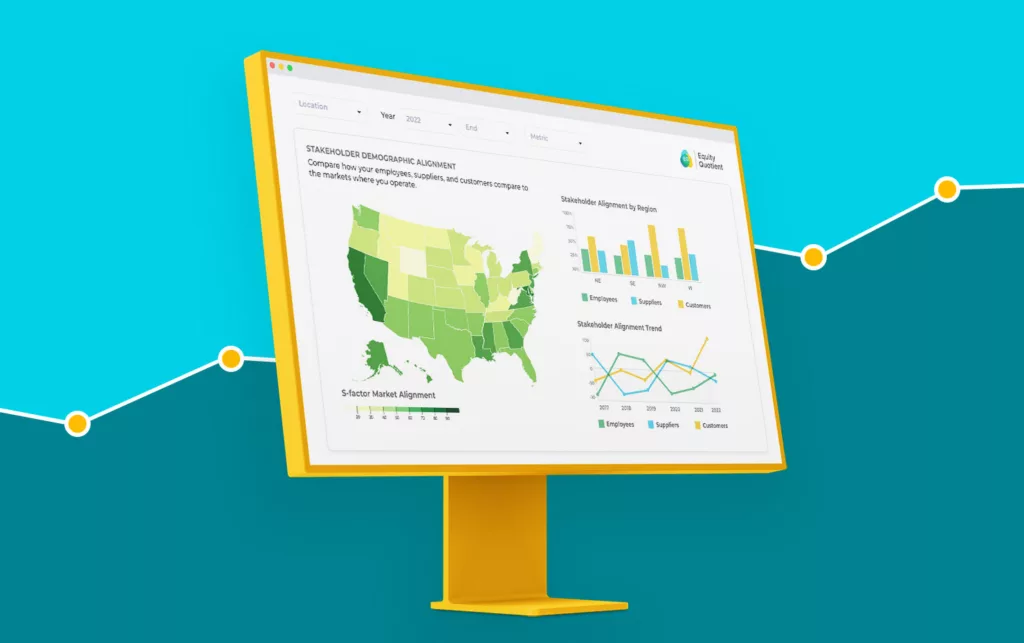
We are charting the future of inclusive AI with our creation of a proprietary data platform, ML-powered analytic model, and use of other advanced AI technologies to create a large language model and make outputs more consumable with natural language processing and interactive visualizations.
With Equity Quotient, executives across sectors better understand their workforce, suppliers, customers, and community to measure impact, automate compliance, and optimize growth.


