An Introduction to ESG
ESG is a standard for evaluating a company’s impact on the environment, society, and governance. Companies that embrace ESG principles tend to outperform their peers on major performance metrics.

An Introduction to ESG
ESG is a standard for evaluating a company’s impact on the environment, society, and governance. Companies that embrace ESG principles tend to outperform their peers on major performance metrics.
Key Highlights:
- Companies that proactively embrace their pursuit of stakeholder diversity and other ESG principles tend to be more successful, outperforming peers on every major performance metric.
- While putting ESG E measurement platforms in place has come with cost and disruption to businesses, companies that have embraced it as a strategic imperative are driving long-term competitive advantage, cost savings, and innovation.
- As with the E, companies that have proactively embraced ESG’s S and related DEI imperatives are realizing competitive advantage and outperforming peers.
- ESG data can be used to create mathematical models that simulate how a company’s ESG performance may impact its financial performance.
- The challenge with ESG’s S is that it has historically lacked the same quantitative rigor that underpins the E.
Table of Contents:
Introduction
Measure. Track. Report.
Meet Equity Quotient
Section ONe
Introduction to ESG

Introduction
What is ESG?
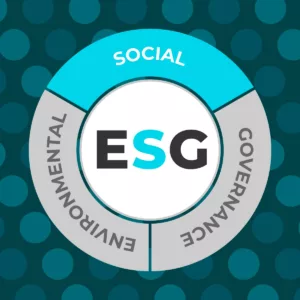
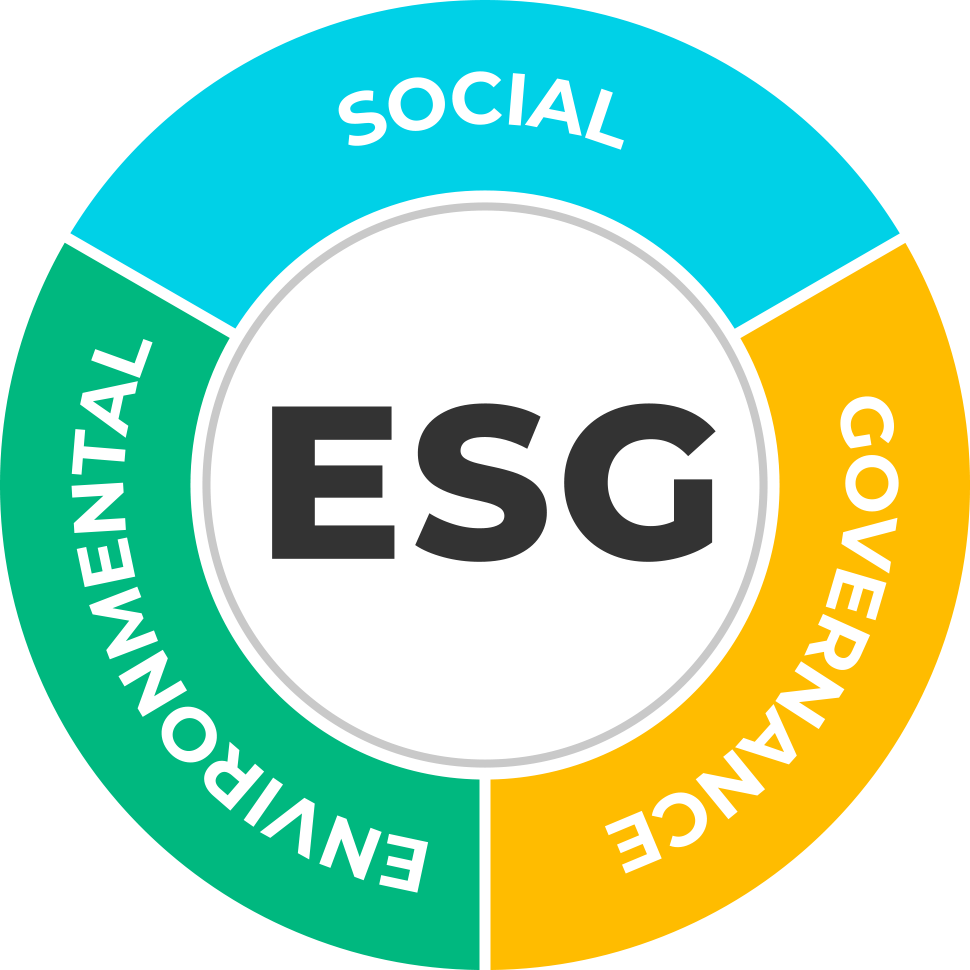
ESG stands for environmental, social and governance, has become the leading standard for understanding a company’s key risk factors and its impact on the communities where it operates.
Despite the debate over ESG as a methodology for evaluating companies, investors and other stakeholders have remained steadfast in insisting that companies will be held accountable for both financial performance and their impact on the world around them. Many see ESG as an imposition and at odds with maximizing shareholder value. However, data suggests that significant opportunity exists in finding the intersection of performance and purpose.
Companies that proactively embrace their pursuit of stakeholder diversity and other ESG principles tend to be more successful, outperforming peers on every major performance metric.


The E is for Environment
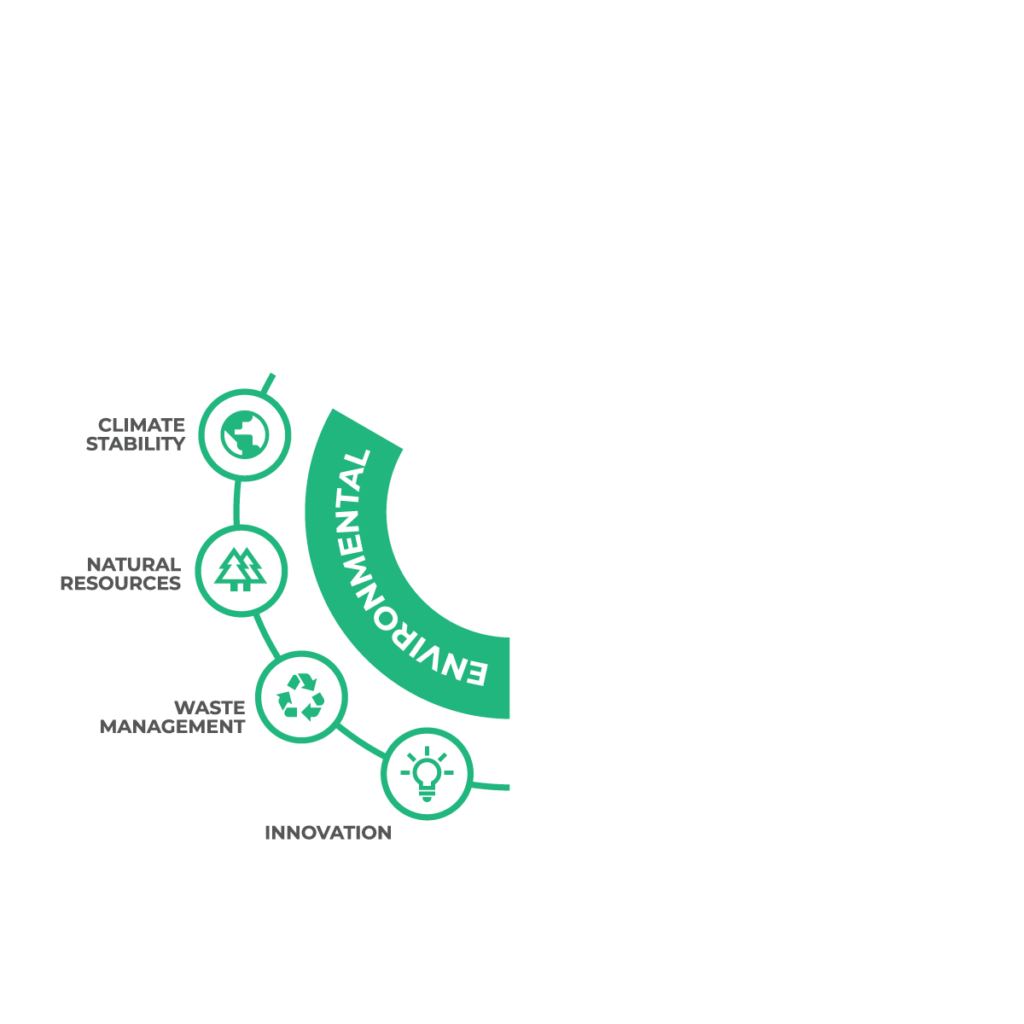
While putting ESG E measurement platforms in place has come with cost and disruption to businesses, companies that have embraced it as a strategic imperative are driving long-term competitive advantage, cost savings, and innovation.
The S is for Social
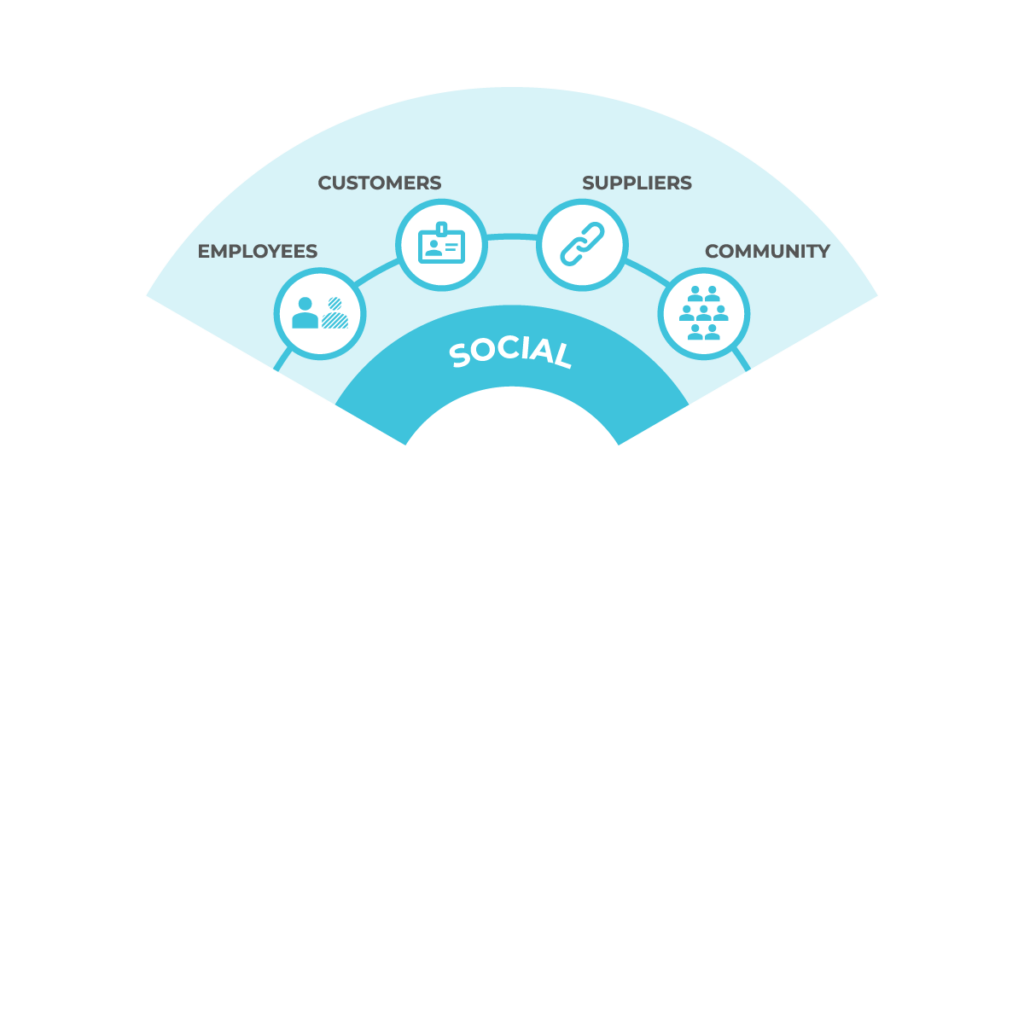
The S is intended to measure a company’s social impact on its stakeholders, or its relationship with employees, suppliers, customers, and surrounding communities. Similar to the E, the S has seen a rise in scrutiny and calls for transparency and accountability related to an organization’s impact on its people portfolios.
The COVID-19 pandemic and the global movement for racial and ethnic equity provided investors with a new sense of urgency around understanding social risks, such as access to education, employment and wealth building opportunities; diversity of stakeholders and equity across pay, pricing, and other economic factors; health, safety, and human rights. . Even those steeped in ESG are surprised to learn that the S typically outweighs the E and G combined at over 50% in most leading scoring models (Note: based on analysis of Morningstar MSCI ESG reports across 10 industries). Meanwhile, a recent study tracking ESG-related public company disclosures by law firm White & Case published by Harvard Law’s Journal indicated that over 50% were S-related as well.
As with the E, companies that have proactively embraced ESG’s S and related DEI imperatives are realizing competitive advantage and outperforming peers.
The business case for proactively integrating the S in ESG into the investment process continues to strengthen: One analysis found that social-related shareholder proposals rose 37 percent in the 2021 proxy season compared with the previous year, according to the Wall Street Journal. Particularly in a more service-centered economy, people are the lifeblood of every organization and comprise an interconnected web that can remain healthy, productive, and successful over the long-term with a virtuous circle across employees, suppliers, customers, and the community. Meanwhile, in a world that now expects transparency and accountability from companies and punishes those that appear to have unfair or negative S business practices, those that struggle to become stakeholder-led are likely to face a vicious circle distracted with negative outcomes and the risk, cost and complexity that accompany them.
Despite the increasing availability of data and technologies to measure and manage ESG imperatives, executives are frustrated with the cost and complexity of achieving robust ESG platforms. A joint UNGC/Accenture study found that 63% of CEOs say that difficulty measuring ESG across the value chain is a barrier to sustainability in their industry. Another study of finance leaders found that under half (47%) set key performance indicators (KPIs) and subsequently sourced data to track, trace and manage the performance of these KPIs. About a quarter (26%) are shown to have clear, reliable data to underpin each of the indicators.
The G is for Governance
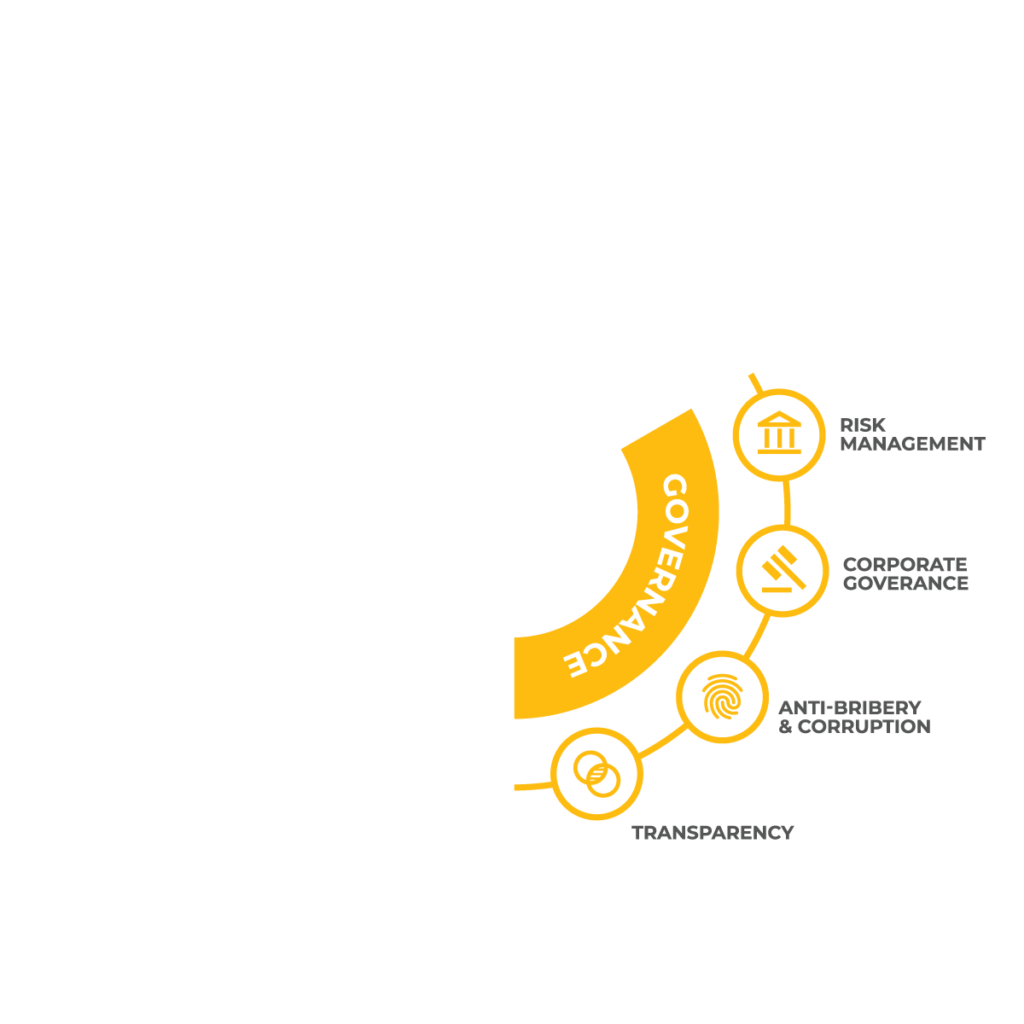
Historically, G has always been a focus for investors and other stakeholders looking to evaluate operational rigor, particularly related to such principles as board composition, executive remuneration, financial controls, risk management, GAAP principles of accounting, and audit discipline.
In more recent years with the pervasive digitization of businesses and interconnectivity around the globe, the G has also come to include analysis of a company’s technology infrastructure that underpins operations across all stakeholders and protects data or intellectual property, often its most valuable, mission critical physical asset.
Section Two
Measure. Track. Report.
Measure. Track. Report.
How companies measure ESG
Accenture and the World Economic Forum identified 21 management practices that move the needle on sustainability. For ESG measurement, most companies are now building robust capabilities around tracking in terms of detailed metrics, analyzing inputs, impacts, and risks across multiple time horizons. Furthermore, they are creating skilled, strategic teams and a robust learning culture focused on building resilience and agility throughout the entire value chain.
Included here are a few examples of how companies are measuring and managing ESG to mitigate risk and achieve compliance imperatives:
- ESG data dashboards: ESG data is becoming increasingly available thanks to the rise of ESG reporting standards and the development of ESG data analytics tools. Dashboards are a great way to track relevant ESG data because they provide a clear and concise overview of a company’s ESG performance and impact. ESG-focused data can be used to track a wide range of factors, including a company’s greenhouse gas emissions, water usage, employee satisfaction, and diversity. By tracking ESG data, investors can gain a better understanding of a company’s ability to manage these important issues. There are many different aspects of ESG that can be tracked on a dashboard. For example, a company’s carbon footprint is an important environmental factor. Social factors include things like employee satisfaction and diversity. Governance factors include things like board composition and executive compensation.
- ESG social media tracking and analytics: Social media is an important platform for conveying ESG information to stakeholders. Tracking and analyzing ESG social media activity can help companies and organizations understand how they are perceived by the public, identify key ESG issues, and track progress over time. ESG social media tracking and analytics can also help businesses make better-informed decisions about where to allocate resources to achieve the greatest impact to manage their brands and proactively mitigate the risk of reputational damage.
- ESG data analytics and modeling: ESG data analytics is the process of collecting, storing, and analyzing data related to a company’s ESG performance. ESG data is becoming increasingly important for investors and companies alike. ESG data can help investors assess a company’s performance in areas like environmental sustainability, employee relations, and corporate governance. This data can come from a variety of sources, including financial reports, public disclosures, media coverage, and third-party ratings. ESG data analytics can be used to track a company’s progress on ESG goals, identify areas of improvement, and compare ESG performance against peers. ESG data analytics can also be used to generate ESG metrics, which are numerical values that represent a company’s ESG performance.
ESG data can be used to create mathematical models that simulate how a company’s ESG performance may impact its financial performance.
By using machine learning algorithms, companies can identify ESG risk factors and forecast how they might impact the company in the future. Analyzing a company’s financial filings, news articles, and other data sources, machine learning algorithms can identify patterns that are associated with ESG best practices. This information can then be used to make strategic decisions about where to allocate resources and how to mitigate risks.
Measure. Track. Report.
The five key capabilities of E measurements
The five key capabilities that underpin E emissions measurement platform have made it possible for organizations to make significant progress in understanding their current state, evaluate current operations for opportunities to improve, chart a path to growth in terms of defined KPIs, and align cross-functionality as an organization to begin making progress that they track dynamically over time.
- Quantitative: The old adage about managing what you measure has been proven time and again, so having an objective, data-driven, and quantitative way to evaluate emissions has been critical.
- Benchmarking: Meanwhile, applying that measurable standard at scale across firms enables benchmarking, which helps both companies and stakeholders understand where each company stands, or how it’s progressing on the journey to net zero, compared to peers.
- Trending: Tracking key metrics compared to peers dynamically makes it possible to keep the challenge and opportunity front and center over time as things evolve–both within the organization and the world around it–and adjust initiatives as needed.
- Configurable: To be relevant and impactful, the model must recognize that every company is unique based on its geography, industry, size, business model, and other relevant factors in setting goals, benchmarking against peers, and providing recommended actions.
- Actionable: Last but not least is that these models tee up recommended actions that are both ambitious and achievable, aligning cross-functional teams around setting strategic goals and continuously collaborating to make progress and remain accountable to each other and their external stakeholders.
The challenge with ESG’s S is that it has historically lacked the same quantitative rigor that underpins the E.
Executives in large financial firms and companies they invest in are quietly saying, “We now have the E well in hand, but it’s the S that’s really keeping us awake at night.” Many see ESG’s S as unavoidably soft and subjective compared to the E, with too many variables and complexity to nail down into a concrete measurement platform that could be used by companies to objectively understand their organization’s stakeholders in the context of the world where it operates and take action to drive both growth and impact.
However, advancements in rich data sources, particularly diversity data that includes demographic information and socioeconomic factors, combined with advanced technologies powered by analytic models and made scalable by artificial intelligence, make it possible to harness the complexity around ESG’s S to achieve consumable, actionable insights.
Meet Equity Quotient
We increase access to socioeconomic data to shape a thriving economy inclusive of the people that drive it.

Humanizing Data. Catalyzing Growth.
Equity Quotient is an AI-powered stakeholder intelligence platform that aggregates a wide range of socioeconomic data into easy-to-use dashboards to help leaders can make more informed decisions to meet both regulatory and market-driven pressure.

We are charting the future of inclusive AI with our creation of a proprietary data platform, ML-powered analytic model, and use of other advanced AI technologies to create a large language model and make outputs more consumable with natural language processing and interactive visualizations.
With Equity Quotient, executives across sectors better understand their workforce, suppliers, customers, and community to measure impact, automate compliance, and optimize growth.


