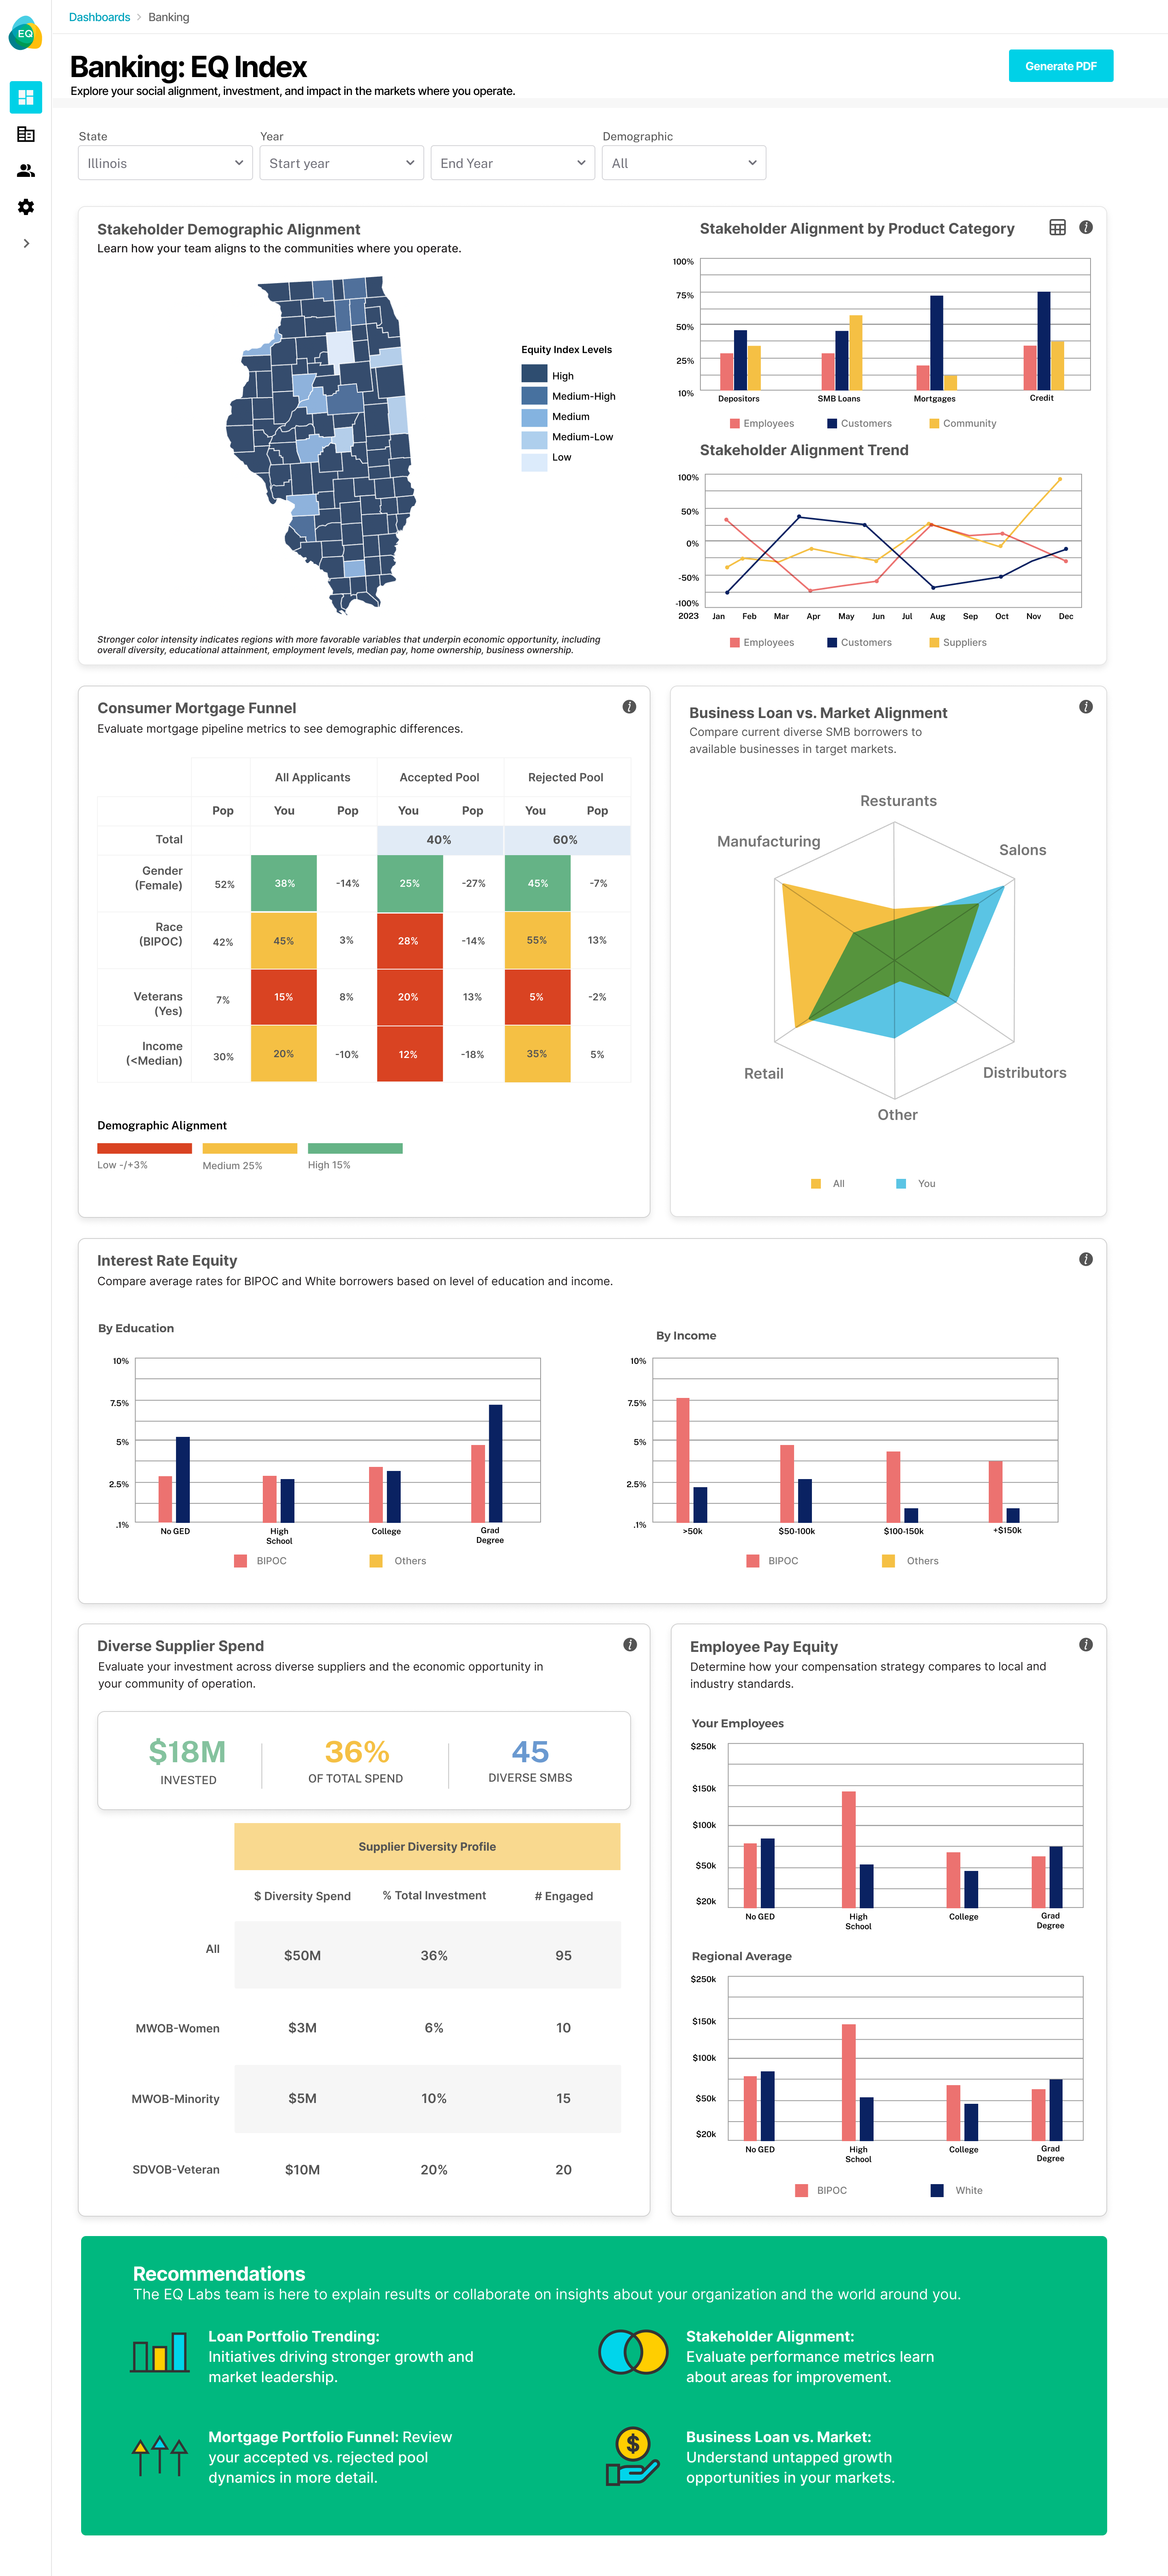
Compare the demographic makeup of your employees to the depositors in your area of operations.
Segment your demographic makeup by stakeholder group (Employees / Suppliers / Customers / Community) for each product category.
Baseline the progress of your EQ S-factor over time relative to your strategic imperatives.
Evaluate mortgage portfolio funnel metrics–all applicants and accepted/rejected rates vs. the community.
Unpack how your business loan portfolio aligns with your local ecosystem of minority & women-owned businesses broken down by industry.
Understand where bias exists in your lending process and how to take action and remain aligned with your strategic objectives.
Be intentional about your procurement strategy and achieve a more cost-effective and resilient supply chain ecosystem.
Prioritize the diversity of your retail banking teams and better understand how pay equity across demographic groups can impact talent acquisition and retention.