Our 3 Part Journey to Growth After Mapping Your Data
Our 3 Part Journey To Growth After Mapping Your Data
With access to rich data and analytics, combining disparate sources into a single picture is more accessible than ever – however creating the path forward from that picture can be confusing. To guide you, here is our 3-part journey to growth you can take after you understand the landscape.
Part 1: Explore Your World
Gain a fresh understanding the challenge and opportunity
One of the most exciting opportunities for growth for the real estate development and financial services sectors is in markets yet to be tapped. Examples of such markets is the 33% of the population that are renters, or multi-generational families living together but have economic independence and the resources needed to own their own home. In the BIPOC community, the home ownership opportunity is significantly higher as only 48% of the population is participating in home ownership at the national level. (Source: US Census, EQ Dashboard Analytics)
Companies looking to uncover opportunities for growth can start with rich data and analytics that tell a story about each market where they’re currently operating or new frontiers that they’re interested in exploring. Historically, this rich data on consumers, housing, and mortgage financing has been stored in disparate systems and required advanced skills to engineer a cohesive picture of the opportunity by region versus your organization’s current state business. New AI-based technologies and advanced data platforms make it possible and cost effective for any company, large or small, to explore the world where they operate, understand their current state compared to what’s available, and discover untapped go-to-market plays.
For example, regional data on home ownership combined with other relevant factors – such as income, education, business and home ownership can provide housing developers and mortgage bankers unprecedented insights.
Part 2: Chart a Strategy
Capitalize on the power of growth insights through data and analytics
On the demand side of the equation, U.S. Census data intersected with rich private data sources on consumers and businesses can provide a valuable starting point for understanding where the most significant opportunity areas exist. Looking at population metrics by race along with metrics such as average income, business ownership, educational attainment, and home ownership levels surfaces insights into where a critical mass of eligible borrowers exist. This data-driven view of markets throughout the United States can help real estate development and consumer banking leadership teams determine where opportunities exist for growth within their existing markets or in potential expansion regions.
Meanwhile, real estate and consumer banking leadership teams can overlay the housing supply landscape onto the demand picture to start honing in on where to focus investment and growth initiatives. Looking across the country, you might see that many communities have strong demand metrics, but lack inventory of attainable housing. Additionally, understanding how median incomes compare to median home prices within a given subregion can provide insight into the level of affordability, guiding mortgage lenders to where that factor is relatively low or perhaps real estate developers to where it’s relatively high and an opportunity exists to achieve attainable housing developments for first time home buyers. Furthermore, comparing affordability to availability, or the number of housing units in market per available home buyer in a given region, can highlight the most significant opportunity areas for leadership teams looking to chart a strategy to growth and take action with investments and execution initiatives.
Part 3: Execute for Success
Align your organization to take concrete action and seize the opportunity
Now that the strategic initiatives have been defined, it’s time to understand specific actions that can drive change needed to capitalize on untapped growth opportunities.
Gaining insights into how consumers experience the credit funnel process within a given region can help us understand key levers that can be adjusted to unlock growth.. From the overall pipeline of applications to approval rates to interest rate pricing to appraisal vs. transaction values, we have an opportunity to evaluate where our business processes could be honed to yield a better financial outcome for our companies, customers, and communities more broadly.
For example, we might see that for a given level of income, education, and property value that one demographic group is experiencing higher rejection rates or anomalously low appraisals compared to other groups despite their comparable income and risk profiles. These metrics help us understand where in the process disparities might exist as applicants traverse from loan origination, approvals, interest rates, and appraisal values. Through these insights, we have an opportunity to evolve execution to widen the aperture of how the process works for all potential homeowners and borrowers in our focus markets and unlock unrealized growth.
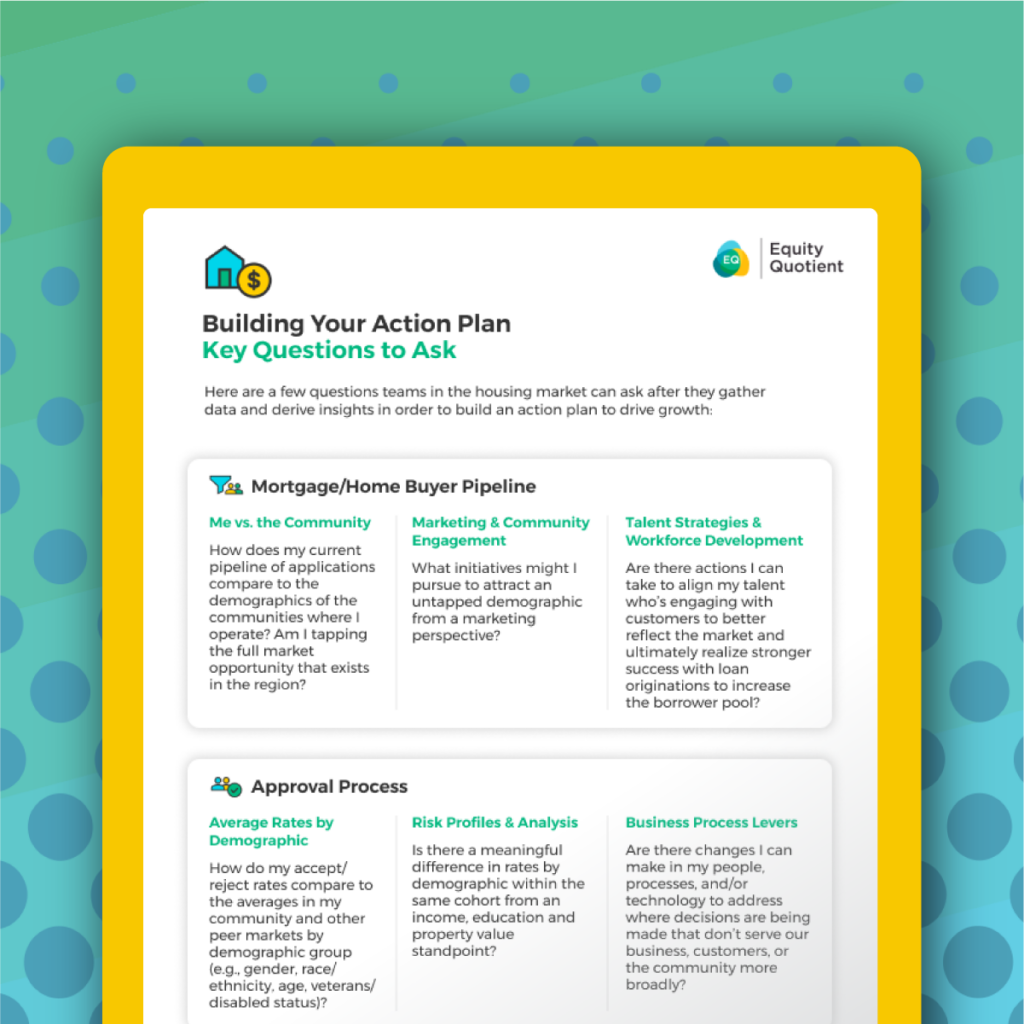
Download our worksheet on specific key questions to ask as you build an action plan.
Get In touch
Now that you’ve seen the power of harnessing the right data,
in order to drive growth and help build a thriving economy, contact our team at EQ and learn more!
GET IN TOUCH