EQ has a new dashboard!
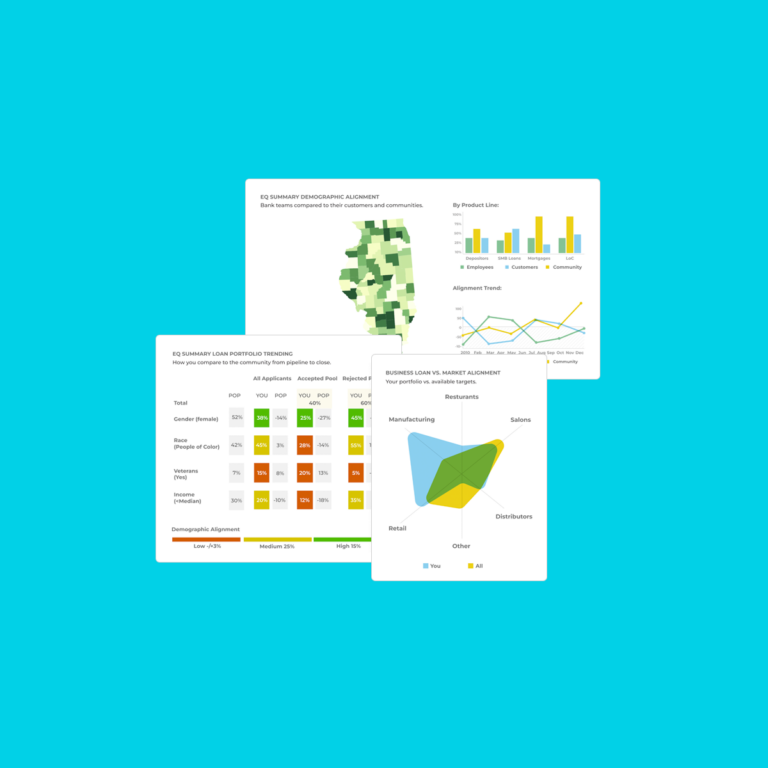
We are excited to share that we have our second dashboard focused on the Housing Market is now available. This dashboard provides a multitude of housing-related insights at a national, state, or county level for BIPOC, Black or African American, American Indian or Alaska Native, Asian, Native Hawaiian or Other Pacific Islander, and Hispanic or Latino groups.
With our new Housing Market dashboard, you will be able to gain new insight into:
- The EQ Opportunity Index: Housing Market profiles each region based on several underlying factors, including racial/ethnic diversity, educational attainment, employment levels, median income/pay equity, home ownership rate, and local real estate market conditions. The index is calculated using a weighted formula of those underlying metrics to convey the relative level of home ownership opportunity in each region across the country.
- The Growth Opportunity Level plots home ownership affordability against homes for sale per potential home buyer for each metropolitan statistical area (MSA). The measures of affordability and inventory per borrower are specific to the selected racial or ethnic group.
- Estimates of the total population and the selected racial or ethnic group population in a region.
- Unemployment rate of the selected racial or ethnic group, in the selected region, and the unemployment rate of a comparison racial or ethnic group.
- Household home ownership rate of the selected racial or ethnic group, in the selected region, and the home ownership rate of a comparison racial or ethnic group.
- Head of household wage disparity between racial groupings. The smaller value indicates the change for the group from previous year.
- Proportions of educational attainment of adults aged 25 and over in the selected region for the selected race or ethnicity and a reference race or ethnicity.
- Median home price by month and the most recent estimate of median annual household income for the selected racial or ethnic group.
- Residential inventory which provides the count of homes listed for sale in selected regions, by month.
- Sale-to list ratio which provides the ratio of median sale price and median list price in selected regions, by month.
- Top opportunity markets provides metrics related to or affecting home ownership opportunity for the selected race or ethnicity by metropolitan statistical area.
Interested in using this dashboard. Click here to get access for free.


